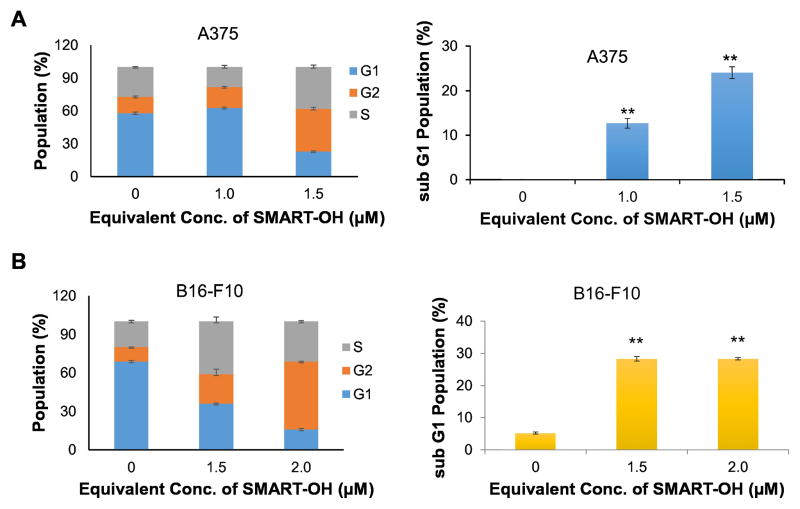
Figure 5. Cell cycle analysis and apoptosis of P-SMART.
Cells were treated with P-SMART for 48 h, stained with propidium iodide (PI), and analyzed on a flow cytometer. A) A375. B) B16F10. Results were expressed as the mean ± SEM (n=3). The percent of cells in G2/M phase and sub-G1 phase was augmented in a dose dependent manner after treatment with P-SMART.

