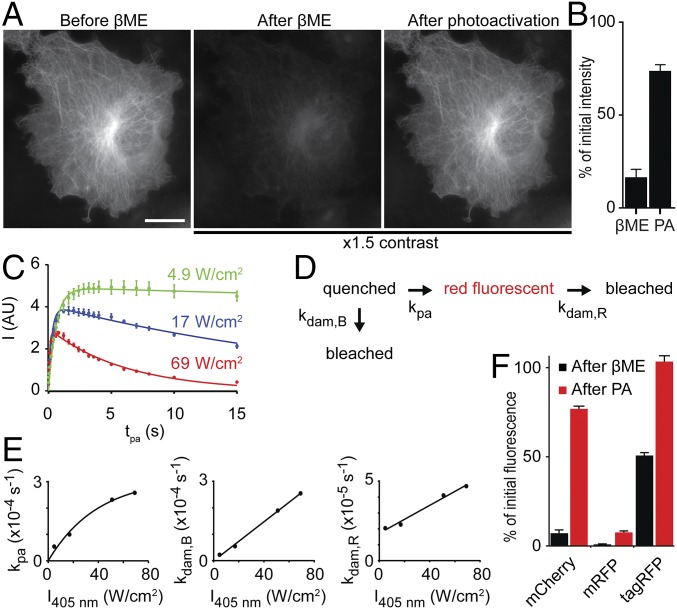
Fig. 1.
RFPs can be caged by βME and uncaged by violet light. (A) Widefield images of a fixed COS-7 cell transfected with mCherry-tubulin, showing the initial fluorescence signal (Left), the fluorescence signal after adding 286 mM βME (Center), and the fluorescence signal after photoactivation with violet light (Right). The image contrast in Center and Right is 1.5 times that in Left. (Scale bar, 20 μm.) (B) Quantification of the fluorescence signal of widefield images of COS-7 cells transfected with mCherry-tubulin after adding βME and after photoactivation as percentage of the initial fluorescence. The fluorescence signal after photoactivation is 73% ± 4% of the initial signal (average ± SEM of 10 cells). (C) Fluorescence intensity of purified mCherry molecules in the presence of 286 mM βME after photoactivation, as a function of photoactivation exposure times for three 405-nm laser intensities. Solid lines indicate fits with a model incorporating both photoactivation and photodamage. (SI Methods, n = 6 measurements per time point). (D) Schematic of the model used for fitting data in E. (E) Rates of photoactivation and photodamage as function of 405-nm laser intensity, obtained from the fits described in C. Solid lines represent exponential (kpa) or linear (kdam,R and kdam,B) fits. (F) Quantification of the fluorescence signal of purified mCherry, mRFP, and TagRFP molecules from TIRF imaging. Black and red bars indicate the percentage of initial fluorescence after adding 286 mM βME and after photoactivation with low 405-nm laser intensity, respectively. n = 4, 2, and 2 samples and n = 40, 24, and 20 measurements for mCherry, mRFP, and tagRFP, respectively.

