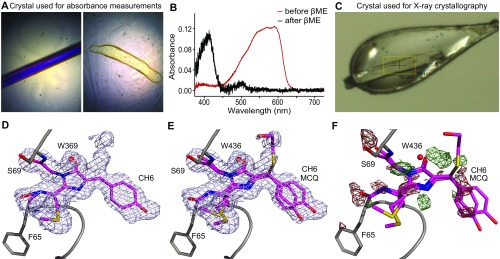
Fig. S1.
(A) Color pictures of the mCherry crystal used for absorption measurements before (Left) and after (Right) soaking in βME. The odd shape of the crystal after soaking in βME is due to βME-induced dissolution because the absorption experiments were performed at room temperature (in contrast to the crystallography, where the crystal is flash-frozen after addition of βME, shown in C). (B) Absorption spectra of the crystals in A. The red line corresponds to the crystal before soaking in βME and the black line to the crystal after soaking in βME. The same absorbance shift is observed as for noncrystallized mCherry after soaking in βME. (C) Color picture of the (near) colorless mCherry crystal just before the start of the X-ray experiment. (D) The 2Fo−Fc map contoured at 0.5 rmsd together with the mCherry crystal structure as found in the PDB (ID: 2H5Q). Extra electron density is present near the Cβ of the chromophore’s tyrosine. (E) The 2Fo−Fc map contoured at 0.5 rmsd together with the two mCherry structures modeled in the electron density as described. (F) Fo−Fc difference map contoured at 3 rmsd, with positive peaks in green and negative peaks in red. The map shows that the model does not completely cover the electron density. Different cyclization reaction products can be fitted in the positive electron density, but cannot clearly be distinguished from each other.

