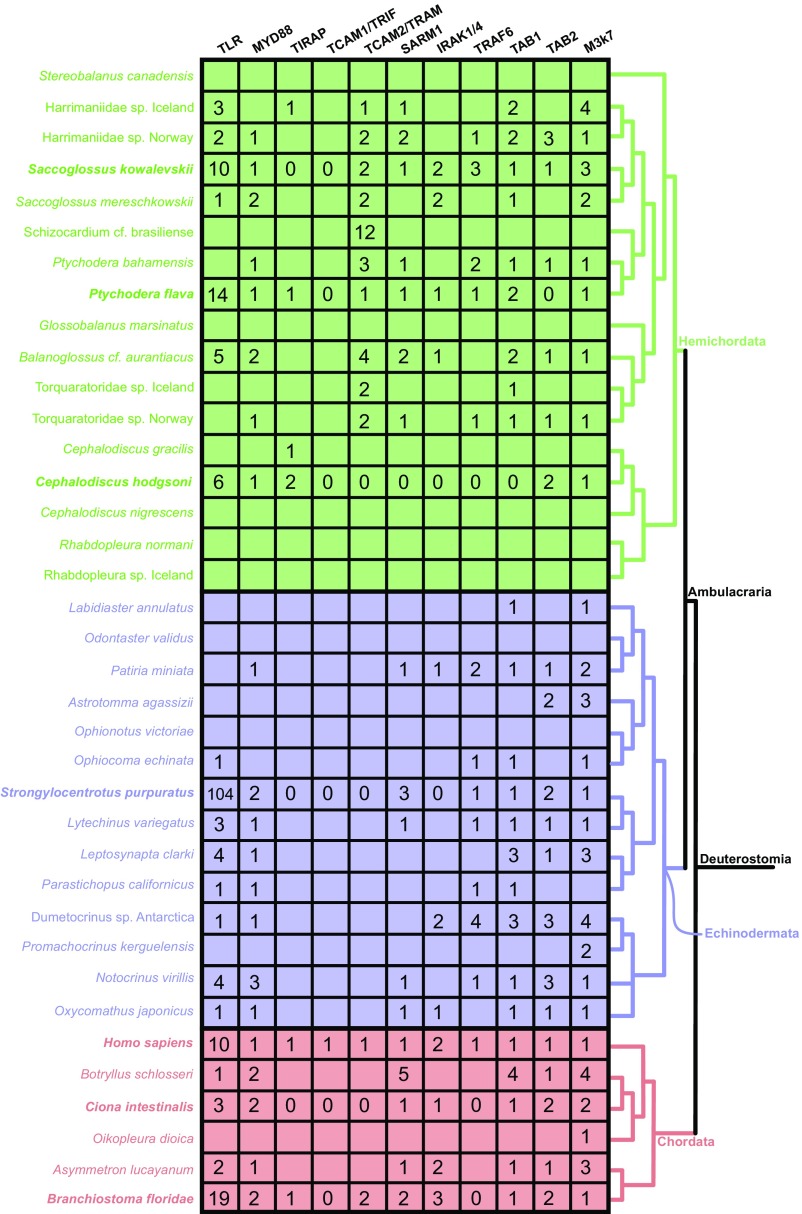
Fig. S2.
Matrix containing the number of homologs identified per taxon. Taxa informed by both transcriptomic and genomic data are indicated in bold. Cells lacking values represent missing data for taxa informed solely by transcriptomic evidence. In contrast, gene absence is denoted by “0” only in taxa for which we analyzed genomic data. A cladogram depicting relationships among taxa is shown at the right of the matrix. Blocks/clades are colored by phylum: Hemichordata are green, Echinodermata are blue, and Chordata are red.

