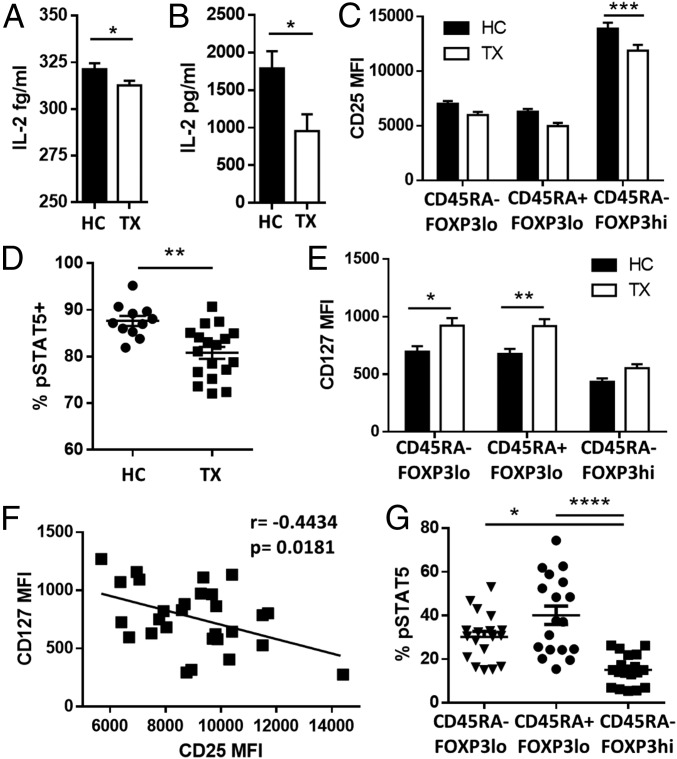
Fig. 2.
Effects of CNIs on IL-2 and IL-7 signaling. (A) IL-2 serum concentration in fresh blood from healthy controls (HC, n = 20) and liver transplant recipients (TX, n = 20). (B) IL-2 production after 5-h whole-blood incubation with phytohaemagglutinin at 37 °C (HC, n = 10; TX, n = 10). (C) Quantification of CD25 expression on Treg subsets in liver recipients (TX, n = 37) and healthy controls (HC, n = 23). (D) STAT5 phosphorylation (pSTAT5) analysis of activated Tregs (CD4+CD45RA−FOXP3hi) in liver transplant recipients (TX, n = 18) and healthy controls (HC, n = 12) after in vitro culture for 30 min with IL-2 (0.2 IU/mL). (E) Correlation between CD127 and CD25 expression in liver transplant patients. (F) Quantification of CD127 expression on Treg subsets in liver transplant recipients and healthy controls. (G) STAT5 phosphorylation analysis of Treg subsets in liver transplant recipients (n = 18) after culture of peripheral blood mononuclear cells (PBMCs) for 30 min with 100 pg/mL of IL-7. *P < 0.05, **P < 0.01, ***P < 0.001, and ****P < 0.0001. MFI, mean fluorescence intensity.

