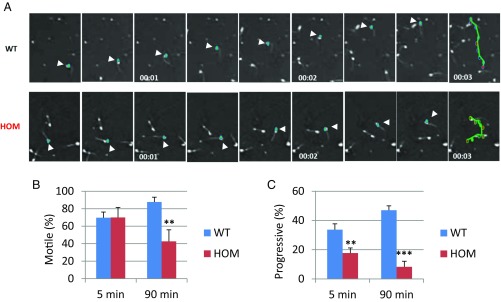
Fig. 2.
Tcte1 null males display asthenozoospermia. (A) Movie frames from recordings of spermatozoa from a control and homozygous mutant male. Teal: sperm head; green: path of an individual spermatozoon (arrowheads highlight sperm head). (B) Percentage of motile sperm from control and homozygous males at 5 min and 90 min (**P < 0.01). (C) Percentage of progressively motile sperm from control and homozygous males at 5 min and 90 min (**P < 0.01, ***P < 0.001).

