Fig. 2.
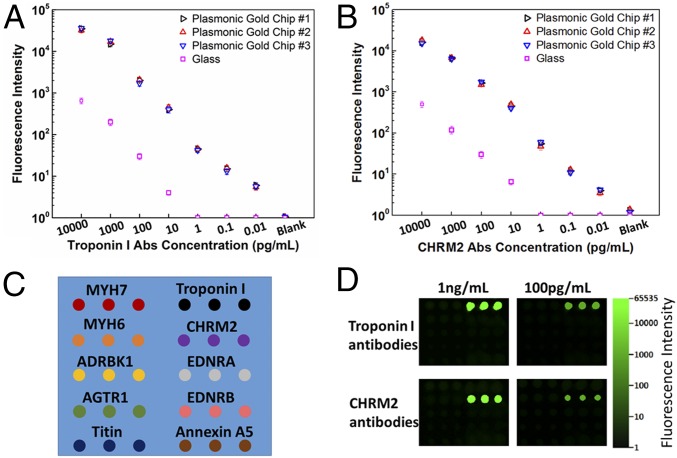
The dynamic range, sensitivity, and specificity of multiplexed antibody detection on plasmonic gold chips. Calibration curves for antibody quantification and for comparing dynamic range and sensitivity of the detection of (A) antibodies to troponin I and (B) antibodies to CHRM2 on plasmonic gold chips and on glass. Samples used for generating the calibration curves were commercial standards with known concentrations of antibodies. Each experiment was performed three times, and the error bars represent the SD. The calibration curve of each antibody was repeated on plasmonic gold chips produced from various batches and the coefficient variation was <14%. (C) Schematic of the 10-plexed antibody detection microarray containing the 10 target antigens immobilized on a gold plasmonic chip for interacting with each of the two commercial troponin I and CHRM2 antibodies. (D) Fluorescence images of the two microarrays on a plasmonic gold chip probed with 1 ng/mL and 100 pg/mL troponin I and CHRM2 antibodies separately. Each array was subsequently detected with 2 nM IRDye 800-labeled secondary antibodies. Fluorescent signals were only observed on the troponin I antigen spots in the microarray probed with troponin I antibodies (Top), whereas only CHRM2 spots showed signals in the microarray probed with CHRM2 antibodies (Bottom).

