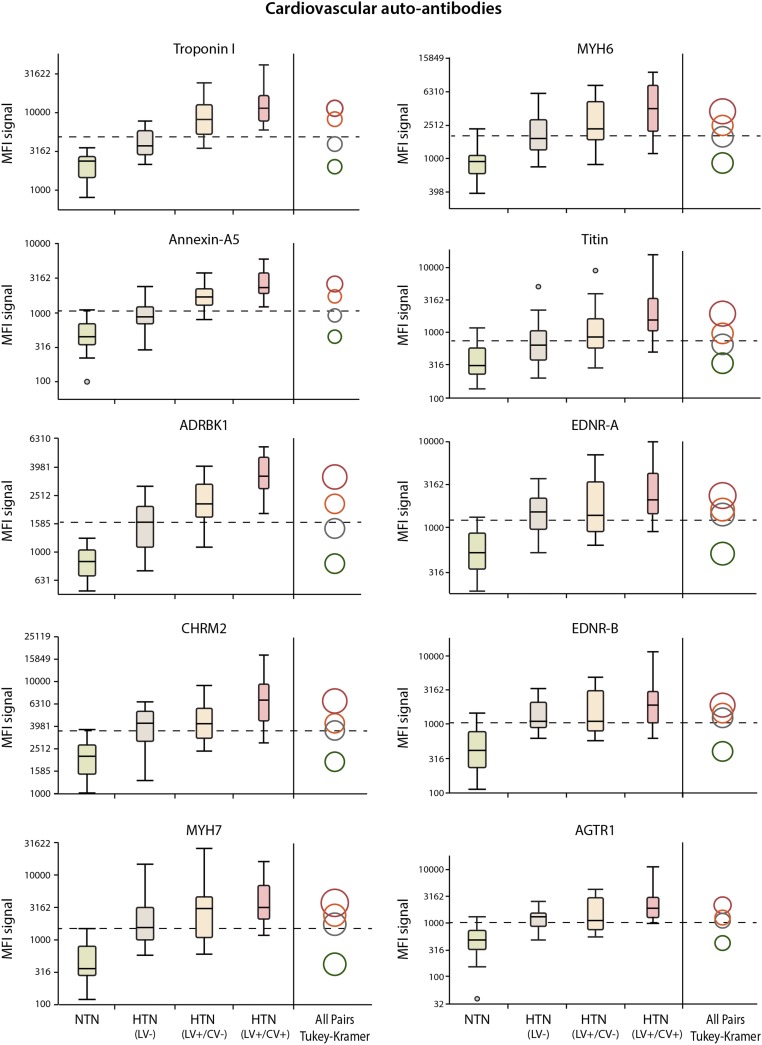
Fig. 3.
Box plots of distributions of the MFI signals of the 10 measured autoantibodies in three groups of hypertensive subjects and healthy participants. Each pair of group means could be compared visually by examining the intersection of the comparison circles. Circles for means that are significantly different between groups either do not intersect or intersect slightly. If the circles intersect by an angle of more than 90°, the means are not significantly different between groups. The radii of the circles depend on the biomarker distribution, the number of tests, and number of subjects per group. The autoantibodies to troponin I, annexin-A5, and ADRBK1 were the most significant markers that best discriminated these four groups of subjects.

