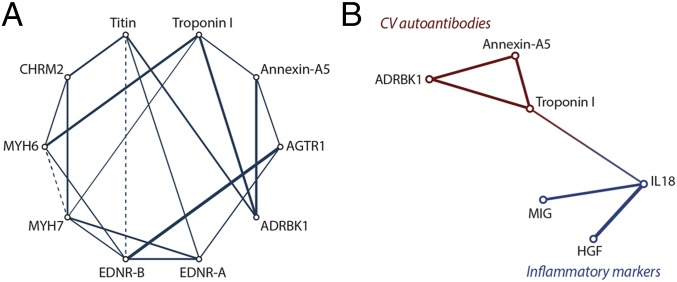
Fig. 4.
Partial correlation diagrams illustrating (A) the intracorrelations among the 10 measured autoantibodies and (B) the correlation between selected CV autoantibodies and proinflammatory cytokines in all participants. Solid lines represent significant (P < 0.01 for all) direct correlations, and dashed lines show significant inverse correlation. Thicker lines correspond to stronger relationships. HGF, hepatocyte growth factor; MIG, monokine induced by gamma IFN.

