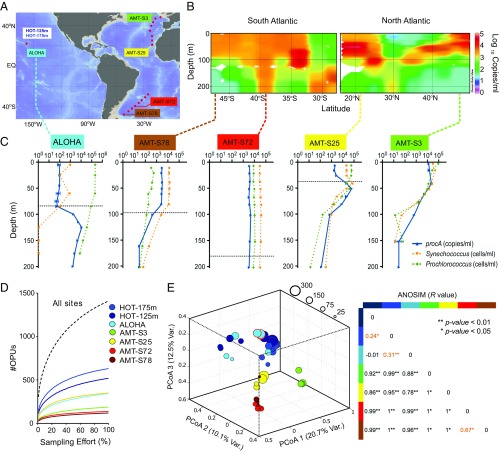
Fig. 3.
Biogeography and diversity of prochlorosin precursor peptides in the Atlantic and Pacific oceans. (A) Oceanic sites sampled in this study. Red dots denote sampling locations: Station ALOHA in the North Pacific and the Atlantic Meridional Transect (AMT13) in the Atlantic. Colored labels correspond to stations shown as depth profiles in C and analyzed by deep amplicon sequencing of the prochlorosin population in D and E. (B) Depth distribution of procA genes within the upper 250 m of the water column along the AMT13 transect. Color-scale indicates the logarithm of concentration in copies/mL as determined by qPCR targeting conserved sequences of the leader peptide region. (C) Depth profiles showing abundance of procA genes (blue) and flow cytometry cell counts of total Prochlorococcus (green) and Synechococcus (orange) at five oceanic sites. Dashed lines indicate the depth of the surface mixed layer, as determined by potential density differential from surface values by >0.125 kg⋅m−3. Mixed layer data are not available for AMT-S3, but from the shape of the profiles it can be presumed to be about 50 m. (D) OPU rarefaction curves for each of the five oceanic sites: AMT-S3 (9, 54, 79, and 104 m), AMT-S25 (17, 53, 83, and 103 m), AMT-S72 (9, 53, 74, and 154 m), AMT-S78 (10, 50, 80, and 160 m), Station ALOHA (25, 85, 100, 125, and 175 m), and two depths from nine monthly time-series samplings at Station ALOHA between June 2005 and February 2006 (HOT-125 m and HOT-175 m). (E) OPU clustering on the basis of a Jaccard dissimilarity matrix (visualized by principal coordinates analysis). Circle diameters are proportional to the richness of OPUs in each sample. We included a technical replicate (same DNA extraction) and a biological replicate (different DNA extraction from the same water sample) of the ALOHA H175 125-m sample as controls for the clustering, outlined in red. ANOSIM R = 1 (complete dissimilarity), R = 0 (complete evenness), and R < 0 (dissimilarity is greater within groups than between groups). Values highlighted in orange correspond to site comparisons for which there was overlap in their OPU populations.

