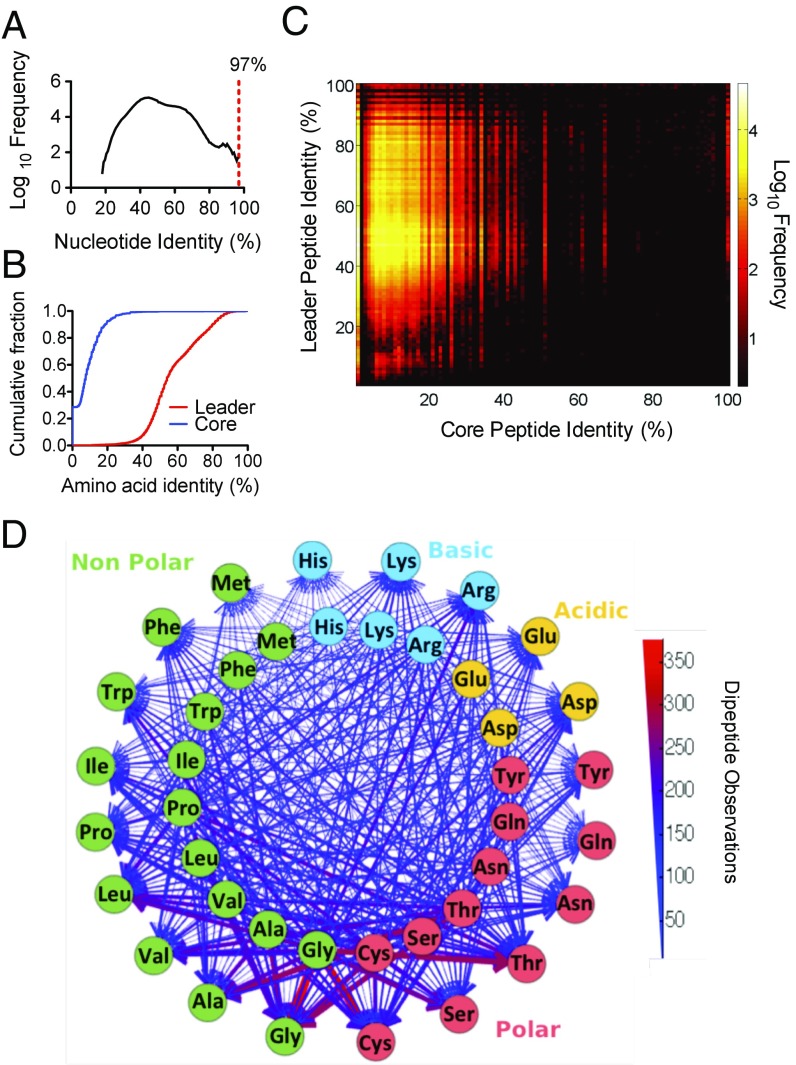
Fig. 4.
The sequence diversity of OPUs from wild populations. (A) Frequency distribution of nucleotide identities among pairwise comparisons in a multiple alignment of all OPUs. The red dashed line represents the 3% distance cutoff used in the procA ORF clustering. (B) Cumulative distribution function of the amino acid identity of the leader and core peptide regions in the dataset. (C) Amino acid identity matrix heat map with every pairwise OPU comparison in a multiple sequence alignment for the core peptide and leader peptide regions. (D) Dipeptide composition of the prochlorosin core peptides identified in the OPUs. Inner and outer circles correspond to the N-terminal and C-terminal amino acid positions, respectively. Lines connecting amino acids represent the dipeptide observations. Color and width of the lines are weighted for the number of dipeptide observations in the dataset.

