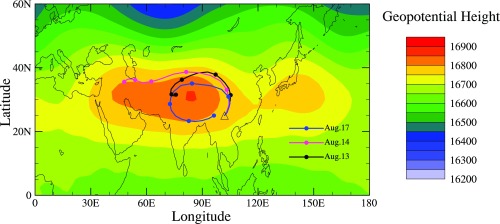
Fig. 1.
Geopotential height at 100 hPa from the GEOS5 data assimilation, averaged from August 13–21, 2015. The black triangle denotes Kunming, China (25.1°N, 102.7°E). Five-days backward trajectories at 100 hPa over Kunming on August 13, 14, and 17 are shown in colored lines and dots on each trajectory line indicate positions at 1-d intervals. The 5-d trajectory uncertainties are estimated as ±5° latitude and ±11° longitude.

