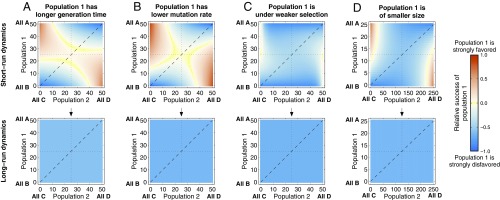
Fig. 1.
Evolutionary dynamics of antagonistic symbioses, when population 1 evolves slower than population 2 owing to (A) a longer generation time, (B) a lower mutation rate, (C) weaker selection, and (D) a smaller population size. Each panel shows the numerically computed dynamics, assuming that both populations coincide in their evolutionary rate parameters except for the parameter explicitly varied. A–D, Upper show, for each initial population state, population 1’s relative success after generations. Except when the populations differ only in their mutation rates, a short-run Red Queen effect operates in all cases: As the blue area covers more than 50% of the square, population 1’s slower evolution leads to its typically being disfavored after 50 generations for a larger fraction of initial population states. The short-run Red Queen effect is strongest for selection strength and population size. A–D, Lower show population 1’s relative success after generations, by which time the starting configuration no longer influences the dynamics: The panels have a uniform color. A strong long-run Red Queen effect is observed in all cases: Population 1’s slower evolution causes a larger fraction of long-run time to be spent in states unfavorable to it. Baseline parameters are , , , , and . (A) ; (B) ; (C) ; (D) , . A generation is elementary time steps of the Moran process.

