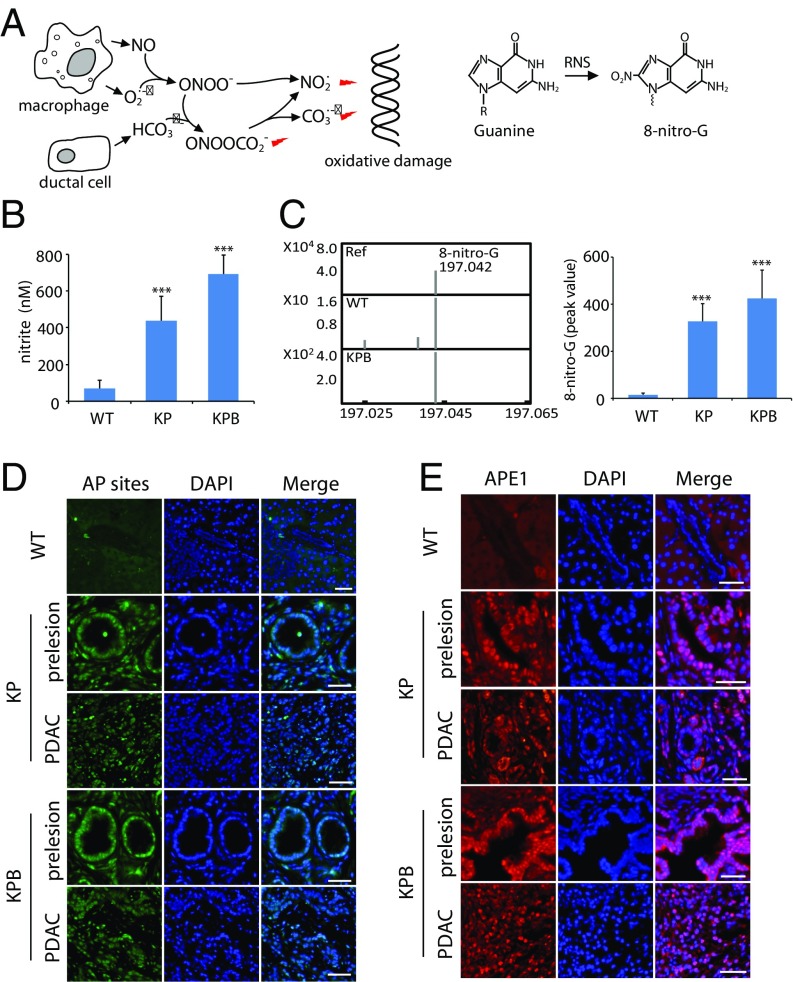
Fig. 2.
RNS and RNS-induced DNA adduct in the KPB pancreases. (A) Schematic diagram of RNS and RNS-induced DNA adducts. (B) The level of nitrite in the pancreases of the WT, KP, and KPB mice was measured. (C) The relative level of 8-nitro-G in pancreases of the WT and KPB mice was examined by mass spectrometry. The molecular weight of the reference of 8-nitro-G and 8-nitro-G isolated from pancreases of the WT and KPB mice was determined by Q-TOF mass spectrometry (Left). Peak value of 8-nitro-G from different samples in the mass spectrometry is shown (Right). (D and E) AP sites (D) and APE1 (E) in the pancreatic tissues of the WT, KP, and KPB mice were immunostained. (Scale bars, 50 µm.) Means and SDs were plotted. ***P < 0.001.

