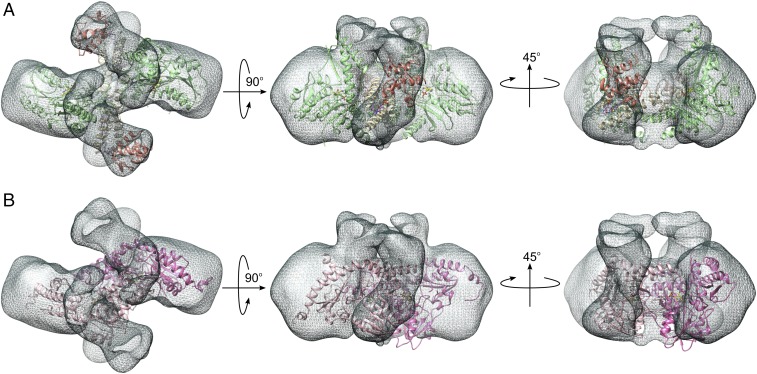
Fig. 4.
Single particle reconstruction of the SDAec complex with EM supports the crystallographic architecture. (A) SDAec was reconstructed from EM images of negatively stained specimens (isosurface contoured with dark gray mesh). The SDAec crystal structure (chains C, D, E, F, I, and L) fit well into the EM density map. Subunits are colored as in Fig. 1. (B) The 3D EM reconstruction does not match well with the architecture of the E. coli IscS structure (subunits shown in light and dark pink).

