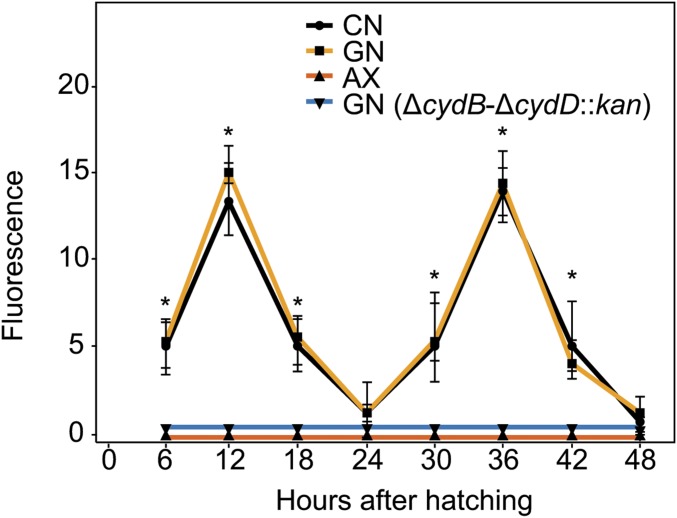
Fig. 2.
Quantitation of Image iT fluorescence in the midguts of conventional larvae (CN), gnotobiotic larvae inoculated with WT E. coli (GN), axenic larvae (AX), and gnotobiotic larvae inoculated with ΔcydB-ΔcydD::kan E. coli [GN (ΔcydB-ΔcydD::kan)]. Individual larvae for each treatment were examined by confocal microscopy from 6 to 48 h posthatching. Fluorescence intensity in the midgut was measured in 10 larvae per treatment and time point using the Pixel Intensity plug-in from ImageJ software (NIH). Mean pixel intensity values ± SD are presented. An asterisk (*) at a given time point indicates that the pixel intensity significantly differed for the CN and GN treatments relative to the AX and GN (ΔcydB-ΔcydD::kan) treatments (ANOVA followed by a post hoc Tukey–Kramer honest significant difference test, P < 0.05). Corresponding confocal images are shown in SI Appendix, Figs. S2 and S3.

