Fig. 4.
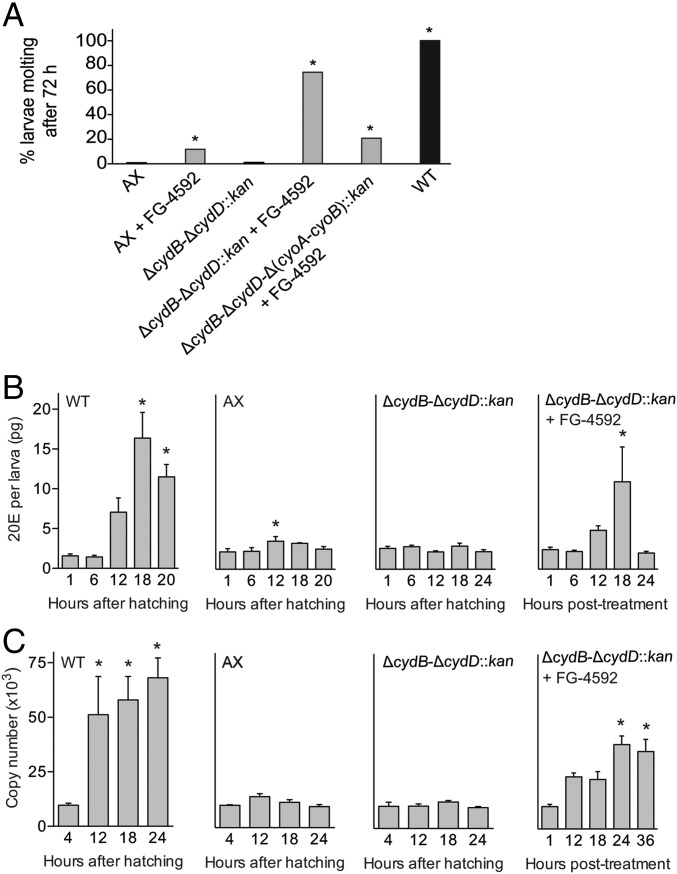
FG-4592 stimulates molting of gnotobiotic larvae inoculated with ΔcydB-ΔcydD::kan E. coli. (A) Percentage of axenic (AX) and gnotobiotic larvae inoculated with ΔcydB-ΔcydD::kan, ΔcydB-ΔcydD-Δ(cyoA-cyoB)::kan, or wild-type (WT) E. coli that molted to the second instar in the presence and absence of FG-4592. At least 40 larvae were assayed per treatment. An asterisk (*) indicates a given treatment significantly differed from untreated AX larvae (negative control) (P < 0.01, Fisher’s exact test). (B) Mean 20E titers (±SE) in gnotobiotic first instars inoculated with WT E. coli (WT), axenic first instars (AX), gnotobiotic first instars inoculated with ΔcydB-ΔcydD::kan E. coli (ΔcydB-ΔcydD::kan), and gnotobiotic first instars inoculated with ΔcydB-ΔcydD::kan E. coli treated with FG-4592 (ΔcydB-ΔcydD::kan + FG-4592). Titers were measured from 1 to 24 h posthatching for the WT, AX, and ΔcydB-ΔcydD::kan treatments. FG-4592 treatment began at 12 h posthatching, with titers measured from 1 to 24 h after treatment began. For each treatment, an asterisk (*) indicates the time point significantly differed from the 1-h time point (P < 0.05, ANOVA followed by a post hoc Dunnett’s test). A minimum of four larvae were analyzed per treatment and time point. Methods used for titer determination are discussed in SI Appendix, Supplemental Experimental Procedures. (C) Transcript abundance of the Ae. aegypti E74B gene in the WT, AX, ΔcydB-ΔcydD::kan, and ΔcydB-ΔcydD::kan + FG-4592 treatments. Larvae were collected from 4 to 24 h posthatching or 4–36 h posttreatment with FG-4592, followed by extraction of total RNA and RT-quantitative PCR analysis (SI Appendix, Supplemental Experimental Procedures). The bars in each graph show the copy number of each gene (±SE) per 500 ng of total RNA. For each treatment, an asterisk (*) indicates the time point significantly differed from the 4-h time point (P < 0.05, ANOVA followed by a post hoc Dunnett’s test). A minimum of four independent biological replicates were analyzed per treatment and time point.

