Fig. 4.
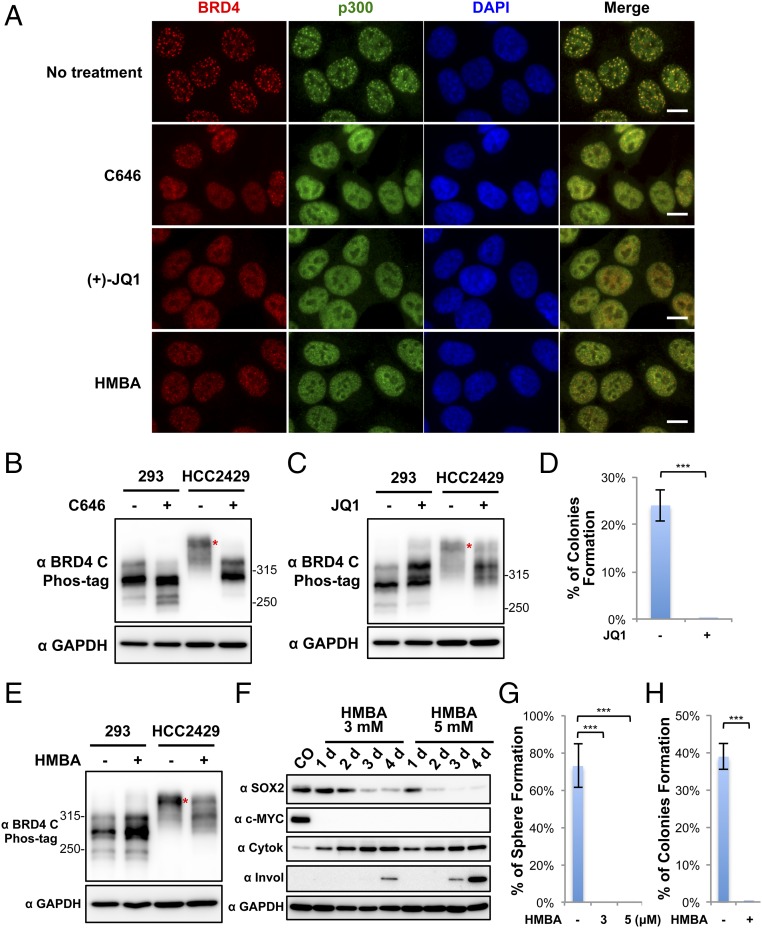
Dispersion of BRD4-NUT foci reduces BRD4 hyperphosphorylation, inhibits downstream oncogene expression, and abolishes NMC transformation. (A) HCC2429 cells were treated with 20 μM C646 for 1 h, 1 μM (+)-JQ1 for 1 h, or 5 mM HMBA for 12 h. Untreated control cells and treated cells were fixed and immunostained with BRD4 C and p300 antibodies and were counterstained with DAPI. (Scale bars: 10 μm.) (B) HEK293 and HCC2429 cells were treated with DMSO or 20 μM C646 for 1 h. Whole-cell lysates were analyzed on Phos-tag or SDS/PAGE gel and were immunoblotted with the indicated antibodies. (C) HEK293 and HCC2429 cells were treated with 1 μM (−)-JQ1 or (+)-JQ1 for 1.5 h. Whole-cell lysates were analyzed on Phos-tag or SDS/PAGE gel and were immunoblotted with the indicated antibodies. (D) HCC2429 cells were seeded in the presence of 100 nM (−)-JQ1 or (+)-JQ1 for the soft agar assay. The percentage of cells forming colonies was calculated from 8,000 seeded cells. Values represent the average of three independent experiments; error bars indicate SD. (E) HEK293 and HCC2429 cells were treated with or without 5 mM HMBA for 12 h. Whole-cell lysates were analyzed on Phos-tag or SDS/PAGE gel and were immunoblotted with the indicated antibodies. (F) HCC2429 cells were treated with 3 mM or 5 mM HMBA. Untreated control (CO) or treated cells were harvested at the indicated times. Whole-cell lysates were immunoblotted with the indicated antibodies. (G) HCC2429 cells were seeded in the presence or absence of HMBA at the indicated concentration for the sphere-formation assay. The percentage of cells forming spheres was calculated from 80 seeded cells. Values represent the average of three independent experiments; error bars indicate SD. (H) HCC2429 cells were seeded in the absence or presence of 3 mM HMBA for the soft agar assay. The percentage of cells forming colonies was calculated from 8,000 seeded cells. Values represent the average of three independent experiments; error bars indicate SD. ***P < 0.001. See also Fig. S4.

