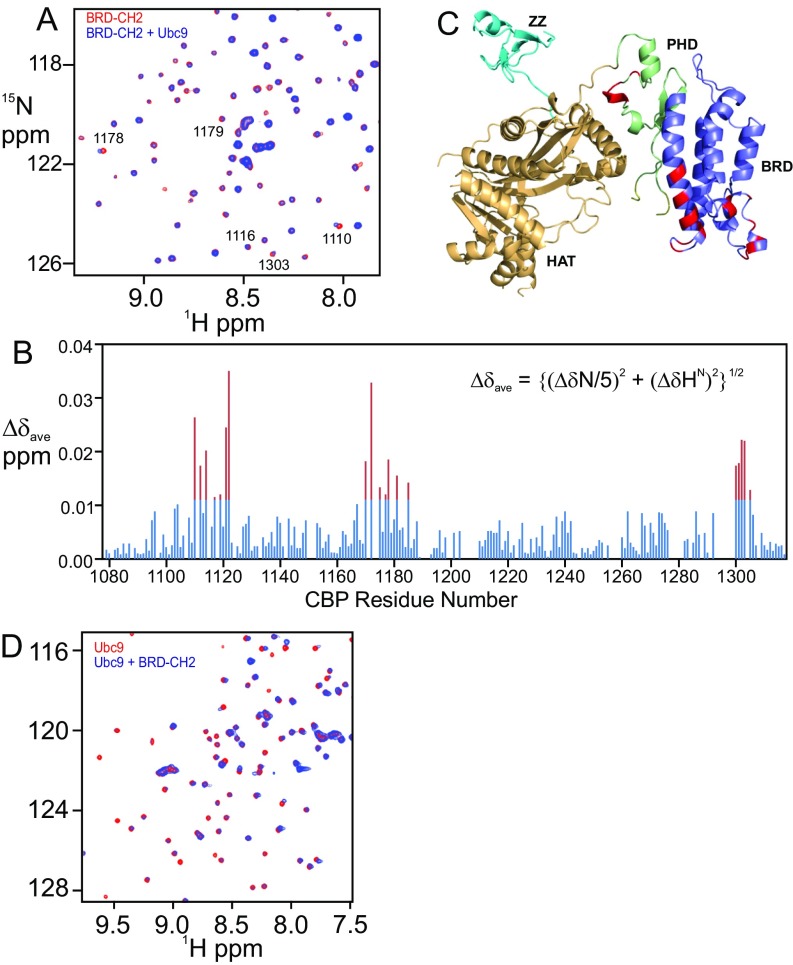
Fig. S5.
BRD–CH2 interacts with Ubc9. (A) Overlay of the 1H–15N HSQC spectra of the 15N-labeled BRD–CH2 free (red) and after addition of equimolar Ubc9 (blue). Peaks that exhibit chemical shift perturbation are marked by residue numbers. (B) Plot of chemical shift differences (∆δave) of the backbone HN and N resonances of BRD–CH2 between free and Ubc9-bound forms (Bottom) versus CBP residue number. Red bars indicate shift changes greater than the average plus 1 SD. (C) Residues in the BRD–CH2 construct that undergo significant chemical shift changes upon addition of 1:1 Ubc9 mapped onto the structure of the CBP catalytic core. Perturbed residues (red) correspond to the red peaks in the histogram in B. (D) Overlay of the 1H–15N HSQC spectra of the 15N-labeled Ubc9 free (red) and in the presence of 1:1 BRD–CH2 (blue).

