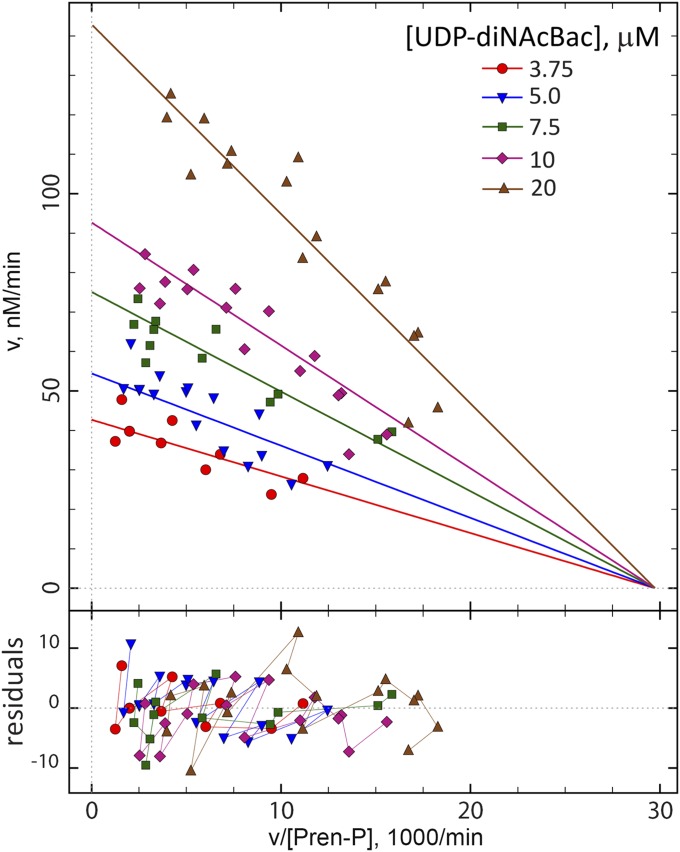
Fig. 5.
Initial rate kinetic analysis of PglC. Initial rates (v, vertical axis) were fit to alternative kinetic mechanisms (SI Appendix, Methods). The best-fit theoretical curves corresponding to the ping-pong kinetic mechanism are shown in the Eadie-Hofstee coordinates [horizontal axis: initial rate v divided by the substrate concentrations (Pren-P)]. The values on the x-axis are multiplied by 1,000. Symbols and best-fit lines correspond to fixed concentrations of UDP-diNAcBac. The intersection point on the horizontal axis illustrates the involvement of the ping-pong mechanism.

