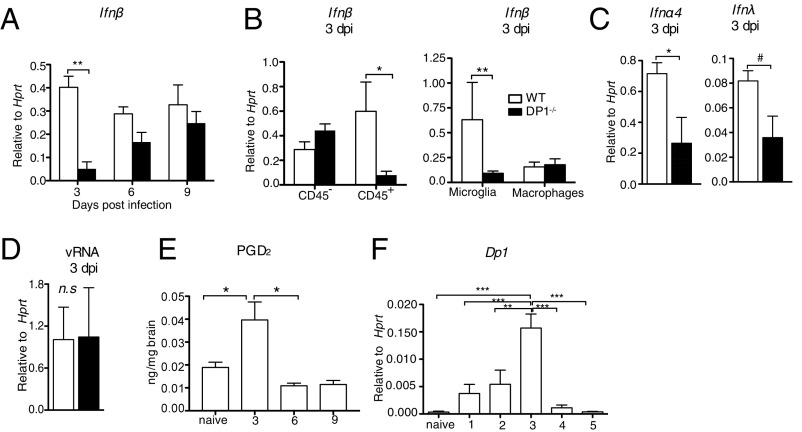
Fig. 2.
Blunted IFN-I response in DP1−/− mice. WT or DP1−/− mice were infected i.c. with MHV, and brains were harvested at the indicated time points post infection for qRT-PCR (A–D and F) and lipid analysis (E). (A and B) Ifnβ mRNA expression on days 3, 6, and 9 post infection in total brain (A) and in CD45− and CD45+ cells (B, Left) and microglia (CD45intCD11b+) and macrophages (CD45hiCD11b+) (B, Right) in WT and DP1−/− mice at 3 dpi. (C) Ifnα4 (Left) and Ifnλ (Right) mRNA expression in microglia of WT and DP1−/− mice. (D) MHV RNA levels in microglia and macrophages (CD11b+ cells) in the brain at 3 dpi. (E) PGD2 levels in the brains of WT mice measured using LC/MS analysis. (F) Dp1 mRNA levels in CD11b+ cells. Data represent the mean ± SEM of two or three independent experiments; n = 4 mice per group; *P < 0.05; #P = 0.053; **P < 0.01; ***P < 0.001, Mann–Whitney U test; n.s., not significant.

