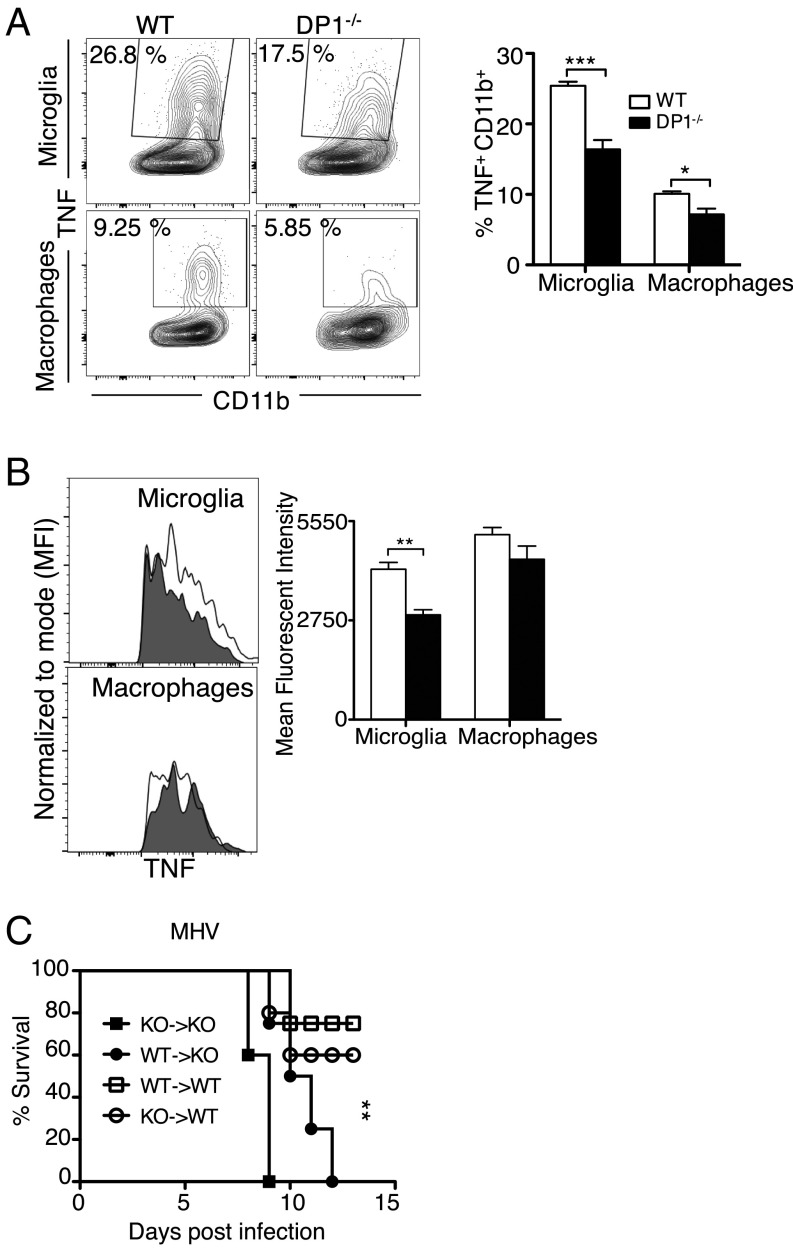
Fig. 3.
Decreased microglia and macrophage activation and function in DP1−/− mice. (A and B) Cells were harvested from the brains of MHV-infected WT or DP1−/− mice on d 3. Functionality of microglia and macrophages are depicted as frequency (A) and mean fluorescence intensity (MFI) (B) of TNF+ cells. Data represent the mean ± SEM of two independent experiments; n = 4 mice per group, *P < 0.05; **P < 0.01; ***P < 0.001, Mann–Whitney U test. (C) WT and DP1−/− reciprocal bone marrow chimeras were infected with 100 pfu of MHV and monitored for survival. Data represent the mean ± SEM of two independent experiments; n = 7 or 8 mice per group; **P < 0.01, Kaplan–Meier log-rank survival test.

