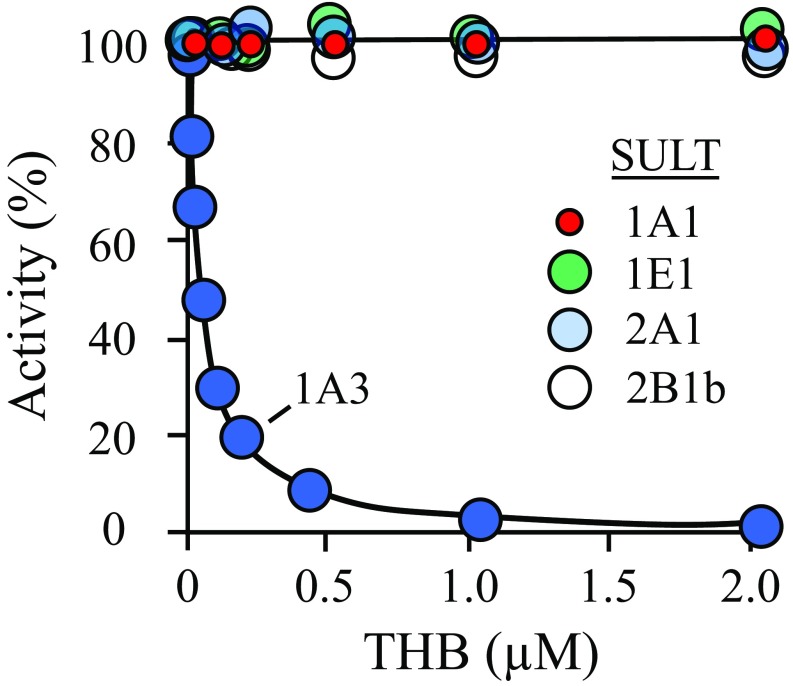
Fig. 1.
THB inhibits SULT1A3 with high affinity and selectivity. SULT initial rates are plotted as a function of THB concentration. Initial rates are plotted as percent of activity at [THB] = 0. Reaction progress was monitored via a sulfonation-dependent change in 1-HP fluorescence [λex 325 nm, λex 375 nm (71)]. Less than 2% of the concentration-limiting substrate consumed at the reaction endpoints was converted to product during initial-rate measurements. Each point is the average of three independent determinations. The SULT1A3 inhibition constant, 23 ± 2 nM, was obtained by least-squares fitting using a single site per subunit model. The line through the SULT1A3 data is the behavior predicted by the best fit model. Conditions: SULT (25 nM, dimer), 1-HP (400 nM for SULT1A3, 20 × Km; 400 nM for SULT1A1, 20 × Km; 800 nM for SULT1E1, 20 × Km; 2.5 μM for SULT2A1, 20 × Km; 3.2 μM for SULT2B1b, 20 × Km), PAPS (6.0 μM, ∼20 × Km), DTT (5.0 mM), KPO4 (50 mM), pH 7.5, 25 ± 2 °C.

