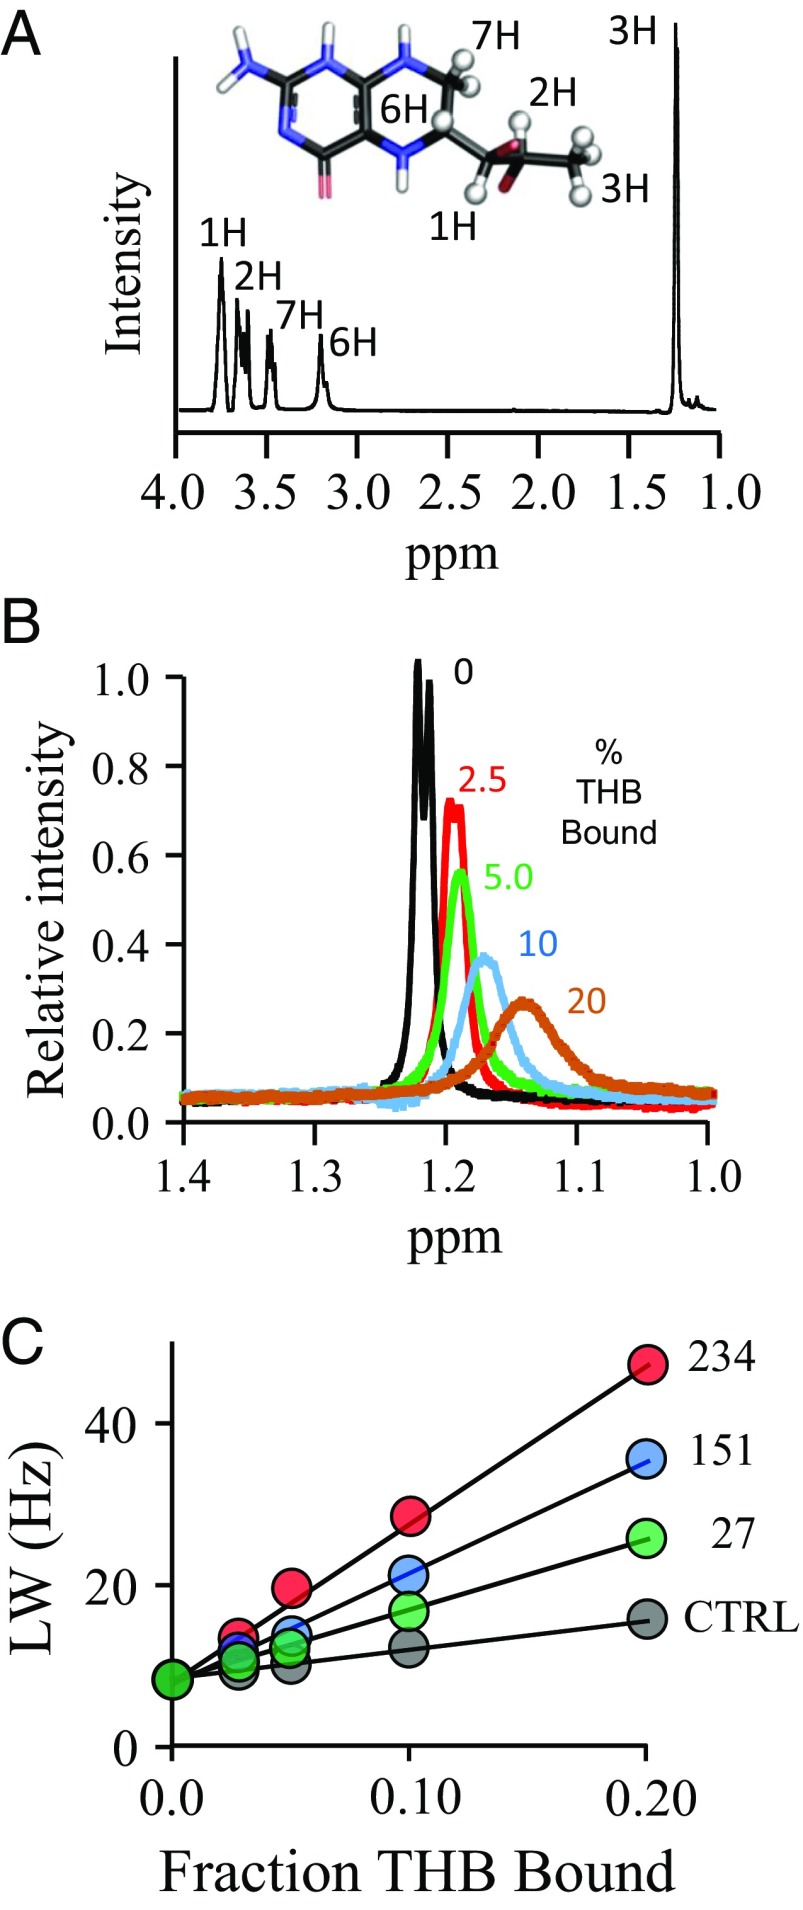
Fig. 3.
The NMR measurements. (A) The structure and 300-MHz 1H-NMR spectrum of THB. The THB protons used to construct the allosteric binding-site structure are depicted as white spheres and are labeled in the spectrum and structure. Peak assignments were determined previously (80). Conditions: THB (100 µM), KPO4 (50 mM), DTTdeuterated (5.0 mM), D2O (>98%), pH 7.4, 25 ± 1 °C. (B) Spin-label effects on the peak of the H3 protons of THB. The solution 1H-NMR spectrum (600 MHz) of the H3 peak of THB is shown as a function of the percent of THB bound to spin-labeled C234-SULT1A3. Conditions: THB [100 μM (brown), 200 μM (blue and black), 400 μM (green), and 800 μM (red)], spin-labeled C234-SULT1A3 [20 µM monomer or 0 µM (black)], PAP (500 µM, 17 × Kd), KPO4 (50 mM), DTTdeuterated (5.0 mM), D2O (>98%), pH 7.4, 25 ± 1 °C. The enzyme is saturated (≥4,400 Kd) at all THB concentrations (Kd THB = 23 nM). Peak amplitudes are normalized to THB concentration. (C) Line width versus fraction THB-bound plots. The effects of paramagnetic and diamagnetic C234-SULT1A3 constructs on the line width on the H3 proton peak of THB are plotted as a function of fraction of enzyme-bound THB. Conditions are described in B.

