Fig. 3.
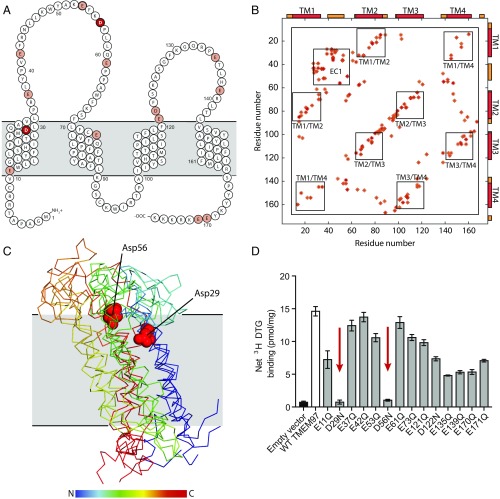
Structural analysis of TMEM97 and mapping of the ligand-binding site. (A) A schematic of TMEM97 in the membrane. Acidic residues chosen for mutagenesis are colored pale red, with Asp29 and Asp56 highlighted in dark red. Membrane helices and TMEM97 topology are according to TMHMM server prediction. (B) Evolutionary coupling map of the top 140 pairs of human TMEM97. Transmembrane helices (TM) and the extracellular domain (EC) are indicated and boxed. (C) Molecular models of TMEM97 generated by evolutionary coupling analysis (29). The top four ranked models are presented. Models are rainbow colored from the N terminus to the C terminus as indicated. The location of the membrane plane was calculated by the PPM server (48) and is shown in gray. Asp29 and Asp56 are shown as red spheres. For clarity a single representative residue pair is presented. (D) Single-point 3H DTG-binding assay of membrane preparations from Expi293 cells expressing TMEM97 single-point mutants. Empty vector is shown as a black bar, wild-type TMEM97 is shows as a white bar, and point mutants are shown as gray bars. Positions 29 and 56, which show abolished binding, are indicated by red arrows. Data are shown as means ± SEM for an experiment performed in triplicate.

