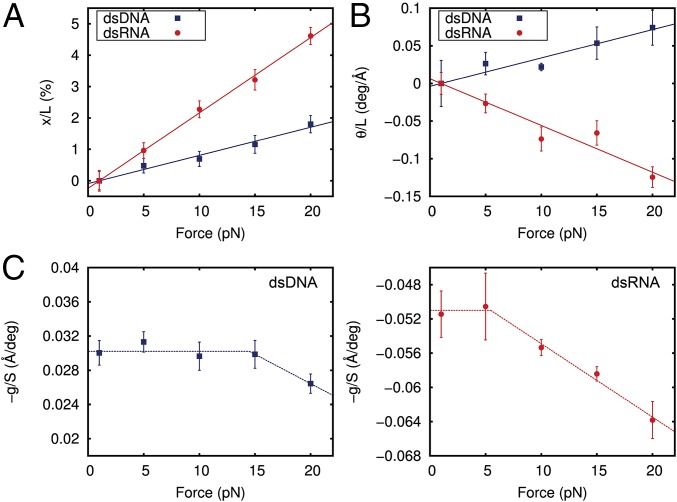
Fig. 2.
Determination of all of the parameters of the elastic rod model from MD data. (A) Relative change in extension of dsDNA (blue) and dsRNA (red) with respect to the extension at F = 1 pN and as a function of the applied force. The extension was computed as the mean value of the helical rises of the 10 central base pairs averaged over the last 0.8 μs (400,000 simulation frames) at each constant force. The linear fits have slopes of (89 ± 4) × 10−5 pN−1 and (240 ± 4) × 10−5 pN−1 for dsDNA and dsRNA, respectively. (B) Absolute change in the twisting angle of dsDNA and dsRNA with respect to the simulation data at F = 1 pN divided by the extension at F = 1 pN plotted as a function of the force. The twisting angle was computed as the mean of the helical twists of the 10 central base pairs averaged over all of the simulation frames. A linear fit was performed, yielding slopes of (3.8 ± 0.3) × 10−3 deg⋅Å−1⋅pN−1 and (−6.2 ± 0.6) × 10−3 deg⋅Å−1⋅pN−1 for dsDNA and dsRNA, respectively. deg, degrees. (C) Ratio −g/S was computed at each constant force simulation as the slope of the linear fit of the helical twist as a function of the helical rise (SI Appendix, Fig. S3). Dashed lines are a guide to the eye. Linear fits in A and B were constrained to pass through the origin point (1,0). Error bars were calculated as described in Materials and Methods.

