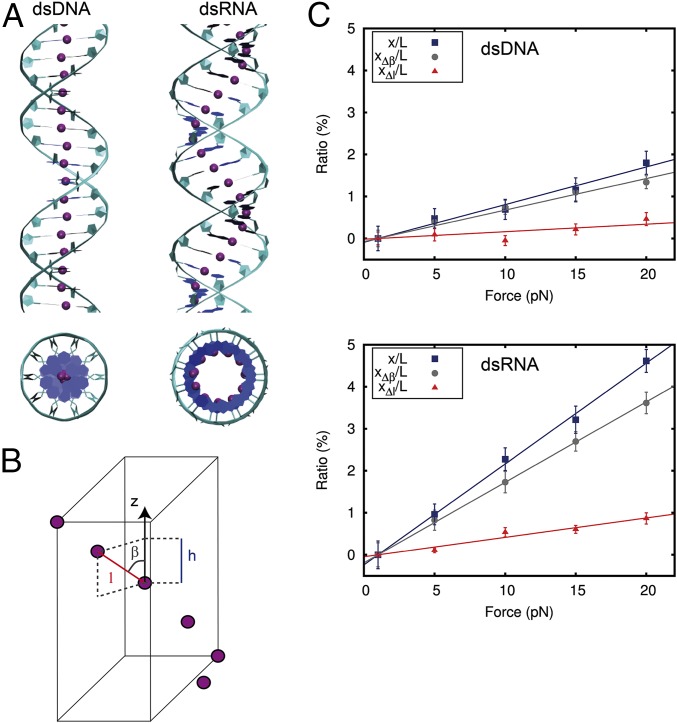
Fig. 3.
Discrete model explains the different stretching response of dsDNA and dsRNA. (A) Top and side views of dsDNA (Left) and dsRNA (Right) molecules. The model is based on the springiness hypothesis (5, 20), where purple beads represent consecutive base-pair centers and form a chain that runs around the helical axis of the molecules. This chain deviates from the helical axis significantly more for dsRNA than for dsDNA. (B) Each segment is characterized by the three parameters , , and , where is the distance to the next base-pair center, is the projection of on the helical axis, and is the angle defined by these two parameters. The extension can increase by either reducing (i.e., increasing ) and/or increasing . These values are denoted by and , respectively. At first-order approximation, the total change in extension can be written as (SI Appendix). (C) and contributions to the total relative change in extension (same data as in Fig. 2A) for dsDNA (Upper) and dsRNA (Lower). A linear fit constrained to pass through the origin point (1,0) was carried out for each dataset. From the slopes, we calculated = 1,330 ± 50 pN, = 522 ± 3 pN, = 5,600 ± 1,500 pN, and = 2,170 ± 140 pN. Error bars in C were calculated as described in Materials and Methods.

