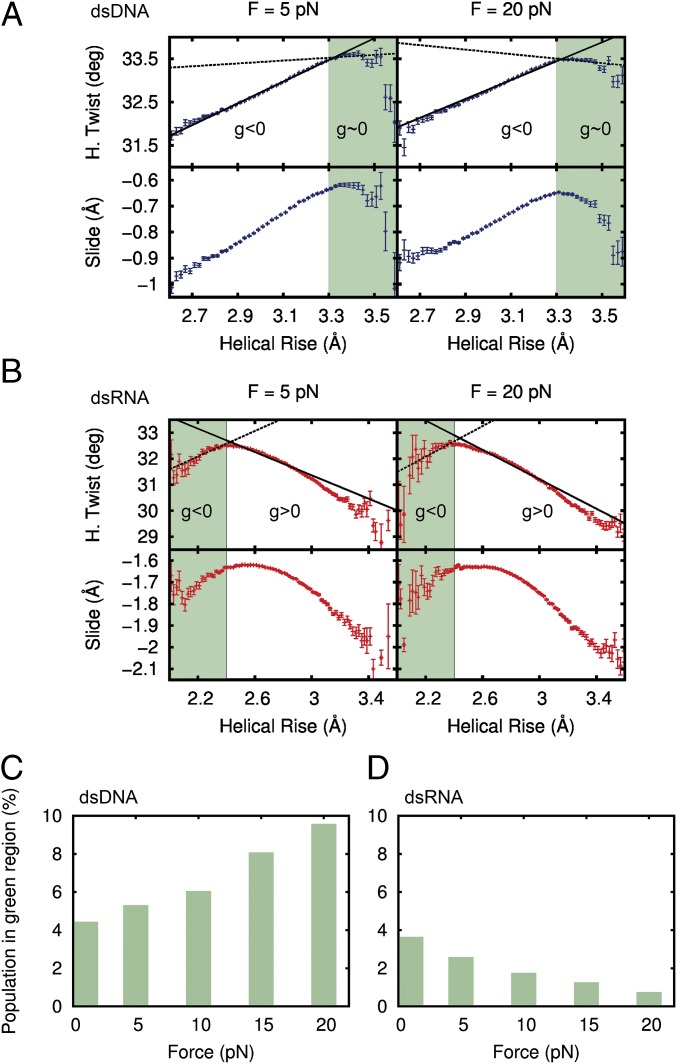
Fig. 5.
Coupling between twist and slide with helical rise as a function of the force. (A) Fluctuations in helical (H.) twist and slide plotted against helical rise at forces F = 5 pN and F = 20 pN for dsDNA. The helical rise was discretized in bins of 0.02 Å, and the mean value of the slide and the H. twist and helical rise were computed in each bin. Error bars are the SEM of each bin. The green region is defined as a helical rise >3.3 Å for dsDNA. The dashed line is the linear fit of the points in the green region, and the continuous line is the fit to all data points. (B) Fluctuations in H. twist and slide for dsRNA. The green region for dsRNA is defined as a helical rise <2.4 Å. (C) Population in the green region for dsDNA at different forces. (D) Population in the green region for dsRNA at different forces.

