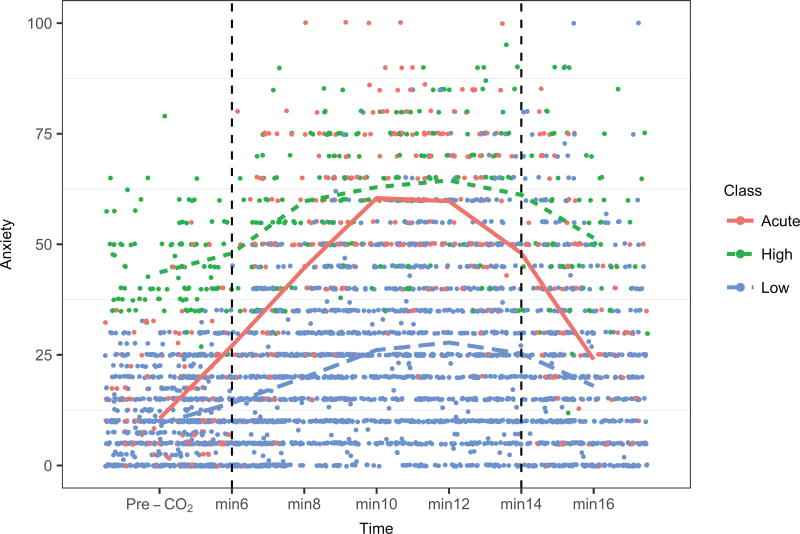
Figure 1.
Anxiety over Time by Class
Note. Min6 = 6th minute of the task, min8 = 8th minute of the task, min10 = 10th minute of the task, min12 = 12th minute of the task, min14 = 14th minute of the task, min16 = 16th minute of the task. Dashed vertical lines represent onset and end of CO2 administration. Assessment of anxiety was taken at baseline and then every 2 minutes; a small amount of noise on the x-axis was added at each time point to more clearly separate overlapping points.

