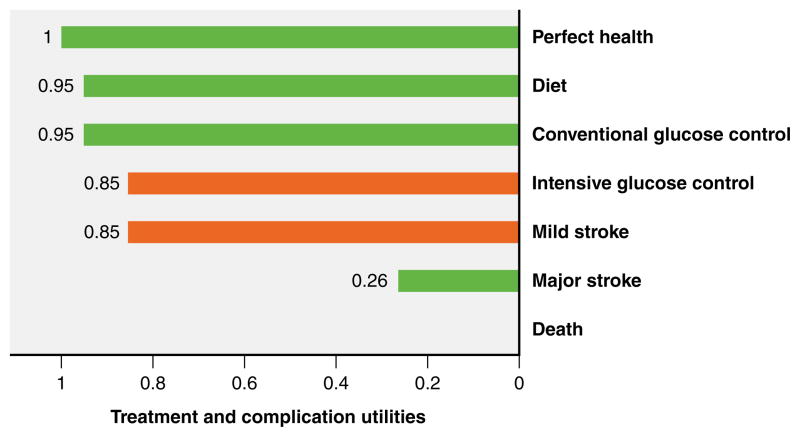
Figure 4. Patients’ Perceptions of Quality of Life for Selected Diabetes Treatments and Complications.
Median quality of life utility values for various treatments and complications were derived from Huang et al.61 The orange bars for intensive glucose control and mild stroke are added for emphasis to highlight that on average, patients perceive these different states as having the same magnitude in the decrease in quality of life.

