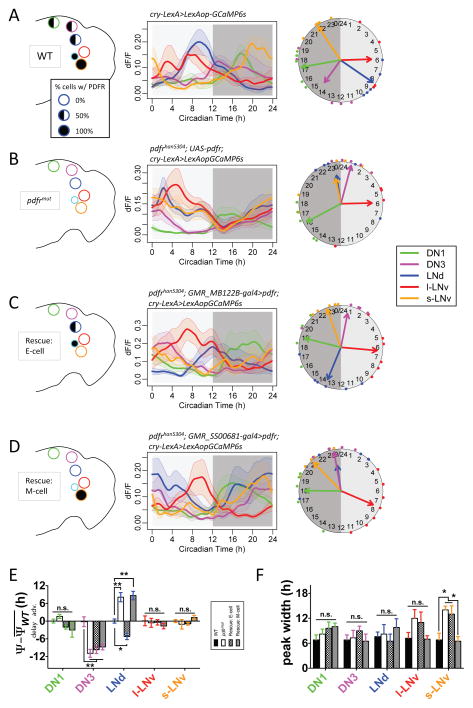
Figure 2. PDFR signaling regulates Ca2+ rhythms in M and E pacemakers by cell autonomous mechanisms.
(A–D) Daily Ca2+ activity patterns of five major pacemaker groups under DD (A) in WT flies (n = 5 flies), (B) in pdfr mutants (n = 6 flies), (C) in an E cell rescue design - wherein E pacemakers (three out of six LNd and the 5th s-LNv) express PDFR in the pdfr mutant background (n = 6 flies), and (D) in an M cell rescue – wherein flies with M pacemakers (four PDF-positive sLNv) express PDFR in the pdfr mutant background (n = 8 flies). Left, schematics of PDFR expression patterns in major pacemaker groups. Filled circles indicate all cells in the group express PDFR. Half circles indicate approximately half of cells in the group express PDFR. Middle, average Ca2+ transients. Right, Ca2+ phase distributions.
(E) Quantification of Ca2+ phase shifts described in panels (A–D). The mean phase of each group in WT controls under DD is set to zero (*p<0.05, **p<0.01, and n.s. - not significant: Watson-Williams test). Error bars denote SEM.
(F) Quantification of peak widths (the full width at half maximum) for Ca2+ transients in all groups and conditions (*p<0.05: Two-way ANOVA, followed by Bonferroni post hoc test).

