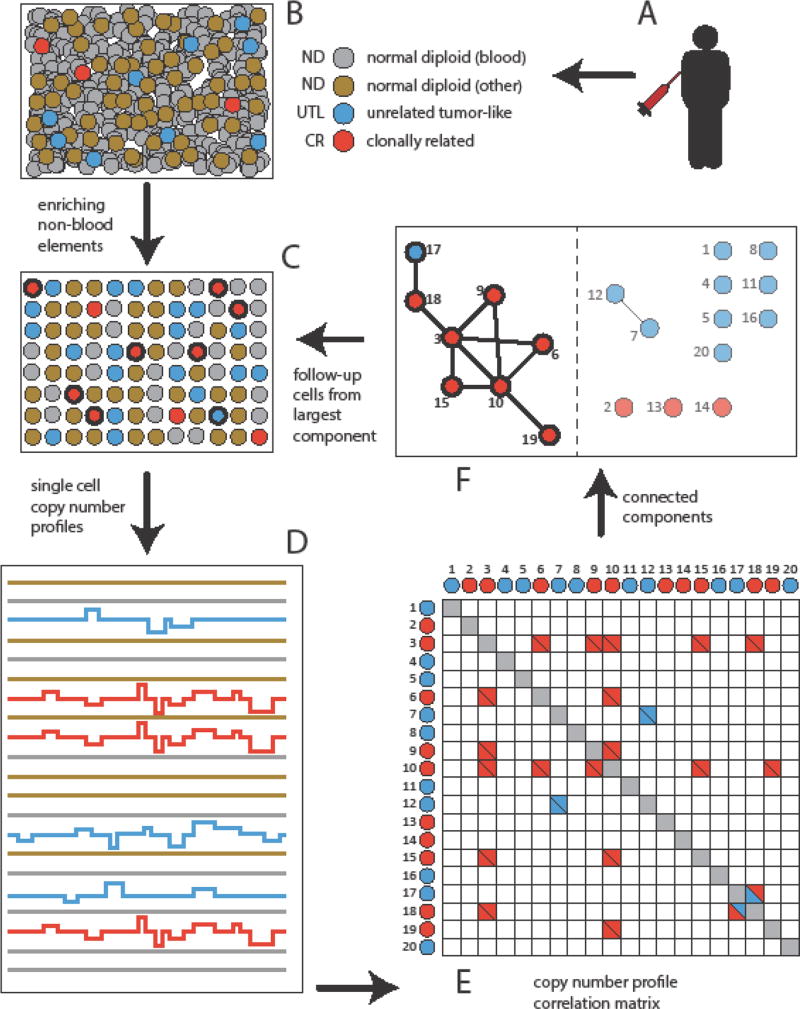
Figure 1. Schematic of Single-Cell Detection Procedure in Blood.
(A–B) Blood is drawn from a subject. (C) Blood elements are removed and cells of epithelial origin can be enriched. (D) Single-cell barcoded DNA libraries are prepared and sequenced, leading to single-cell copy number profiles. (E). Pairwise correlation analysis is performed. (F) A ‘graph’ constructed where ‘vertices’ represent single-cell profiles or ‘bin vectors’, and two vectors are connected by an ‘edge’ if they are highly correlated. The largest ‘connected component’ is identified (F), and resides on the left-hand side of the dotted vertical line. This identifies the clonally correlated cells, indicated in bold. In the illustrated example, the largest connected component of CN profiles is shown, and predominantly stems from the clonally related (CR) tumor cells (3, 6, 9, 10, 15, and 19 in red). Not all tumor cells might be identified this way (2, 13, and 14). In this example, one unrelated tumor like cell (17, UTL) is fortuitously linked to the largest connected component. Two UTLs (7 and 12) also form a small connected component. From the barcodes taken from the largest component, one can return to select cells in (C) (in bold) for deeper analysis; this might confirm cell clonal relations, potentially assess prognosis and therapeutic options, and determine the anatomic origin of the primary tumor.

