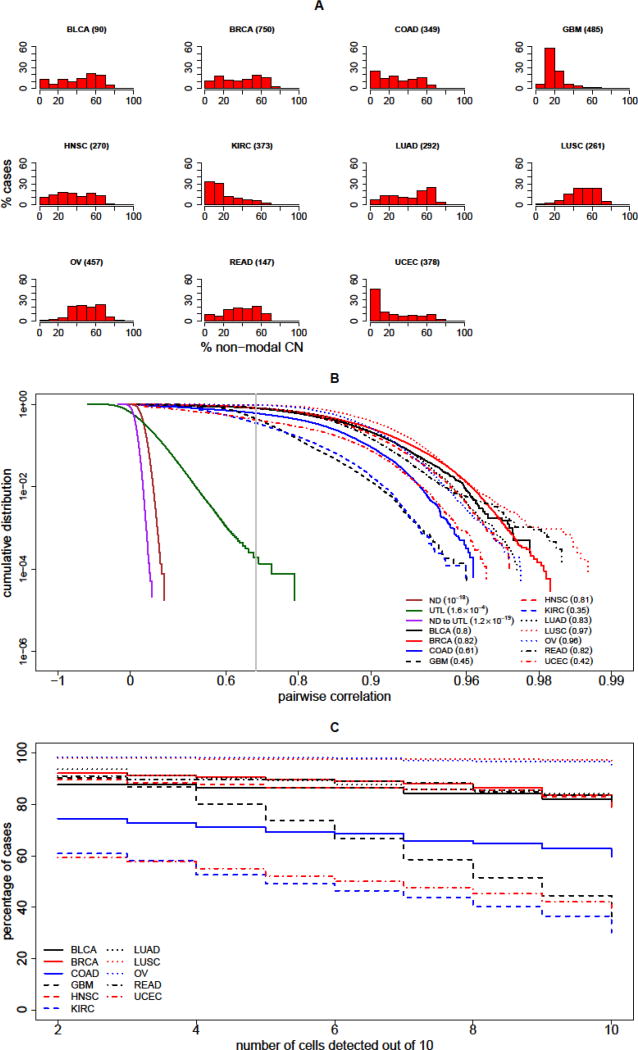
Figure 2. Detection of Clonal Cells in Circulation.
(A) Ubiquity of copy number (CN) variations across multiple cancer types; each histogram shows the percentage of patient cases (vertical axis) with a given percentage of the genome with an abnormal non-modal CN value (horizontal axis). The cancer types represented are (in alphabetical order) bladder urothelial carcinoma (BLCA), breast invasive carcinoma (BRCA), colon adenocarcinoma (COAD), glioblastoma multiforme (GBM), head and neck squamous cell carcinoma (HNSC), kidney renal clear cell carcinoma (KIRC), lung adenocarcinoma (LUAD), lung squamous cell carcinoma (LUSC), ovarian cystadenocarcinoma (OV), rectum adernocarcinoma (READ) and uterine corpus endometrial carcinoma (UCEC). The number of cases for each type is listed parenthetically, and is based on data published by The Cancer Genome Atlas (TCGA) [26]. Thus, for example, 60% of glioblastoma multiforme (~500 cases) have CN alterations in more than 10–20% of the genome. (B) The graph presents the cumulative probability distribution (CDF) for correlation of pairs of single-cell CN profiles. The CDF is plotted for pairs of normal diploid cells (ND, solid brown); for pairs of clonally unrelated tumor-like cells (UTL, solid green); and for mixed pairs of an ND and a UTL cell (ND to UTL, solid magenta). For comparison, the CDF for pairs of profiles from two cells simulated from the same cancer are plotted, and the analysis of each of the 11 tumor types considered is shown, as described in the inset legend. The gray vertical line indicates the discriminatory threshold of 0.7 correlation. The values of the CDF at this threshold are indicated in the inset for each curve in parentheses. These values are taken from the simulations of the 11 tumor types and for UTL cells, and from estimates based on extreme-value theory for ND cells and for the mixed ND – UTL pairs. (C) To assess sensitivity of detection, for each tumor type, the cumulative percentage of patients are plotted against the number of clonal cells detected (out of 10 assumed to be present in the specimen). For example, for BRCA (solid red line) a sensitivity of close to 90% is achieved if the number of clonal cells detected is at least 6. For KIRC (dashed blue line), the sensitivity is approximately 50% for that threshold.

