
Figure 2.
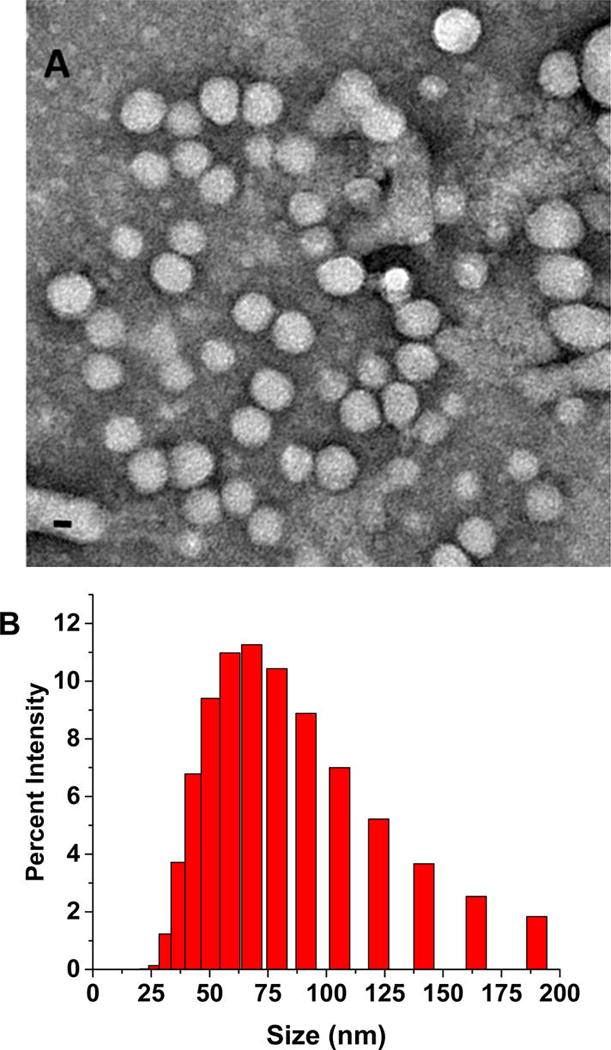
Transmission electron microscopic (TEM) image of polymersomes (scale bar, 20 nm) (A) and the size distribution profile by DLS (B).
Official websites use .gov
A
.gov website belongs to an official
government organization in the United States.
Secure .gov websites use HTTPS
A lock (
) or https:// means you've safely
connected to the .gov website. Share sensitive
information only on official, secure websites.
Transmission electron microscopic (TEM) image of polymersomes (scale bar, 20 nm) (A) and the size distribution profile by DLS (B).