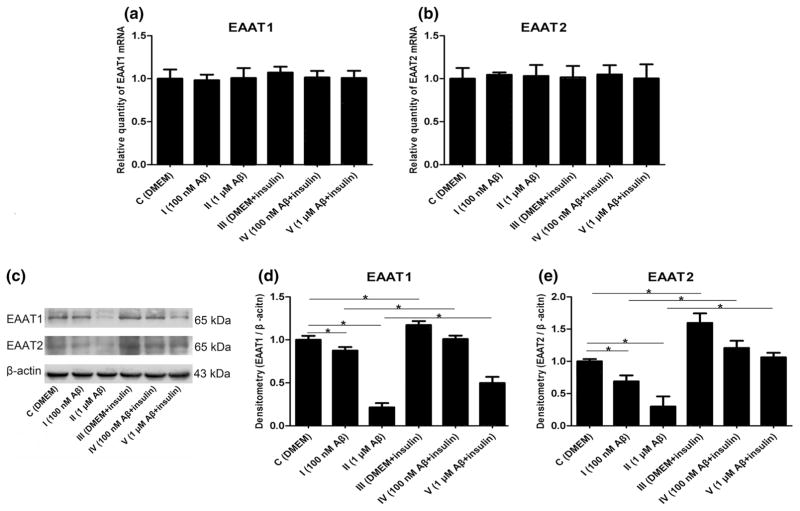
Fig. 5.
Changes in EAAT1 and EAAT2 induced by Aβ1–42 oligomers and insulin: a mRNA levels of EAAT1 (F = 0.362, p > 0.05); b mRNA levels of EAAT2 (F = 0.092, p > 0.05); c representative western blot bands of EAAT1 and EAAT2; d densitometric measurements of EAAT1 normalized by β-actin (F = 312.936, *p < 0.05); e densitometric measurements of EAAT2 normalized by β-actin (F = 95.475, *p < 0.05)

