
Figure 3.
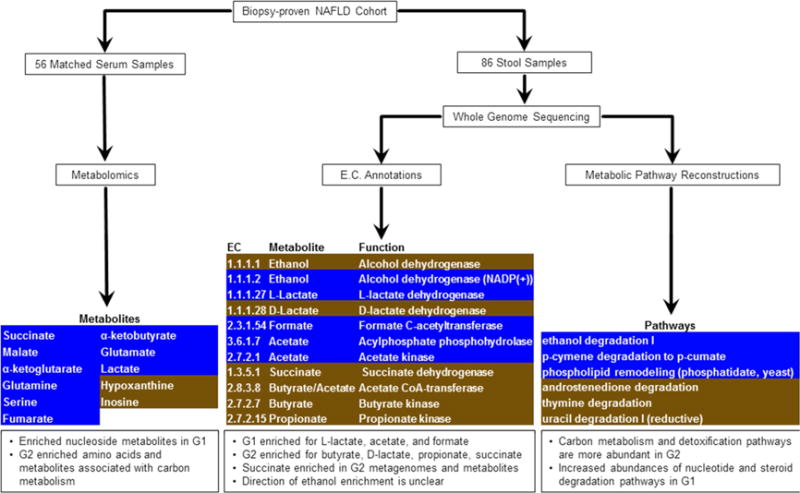
Overview of metabolomic and metagenomic analyses of Biopsy-proven NAFLD patients. Serum and stool samples from a cohort of 86 patients were analyzed for their metabolic and functional content. [Left] The metabolic profiles of 56 serum samples detected several differentially abundant metabolites, after multiple test correction. These are highlighted, with G1 enriched in brown and G2 enriched in blue. [Center] ORF sequences identified from whole genome sequencing of 86 stool samples were used to compute relative abundances of enzymes involved in SCFA production. Several enzymes were enriched in either G1 (brown) or G2 (blue), though they were not statistically significant after multiple test correction. [Right] Metabolic pathways were reconstructed from whole genome sequencing of 86 stool samples. Pathway abundance was calculated by summing the abundances of species in which the pathway was reconstructed. Several pathways were enriched in G1 (brown) or G2 (blue), though these were not statistically significant after multiple test correction.