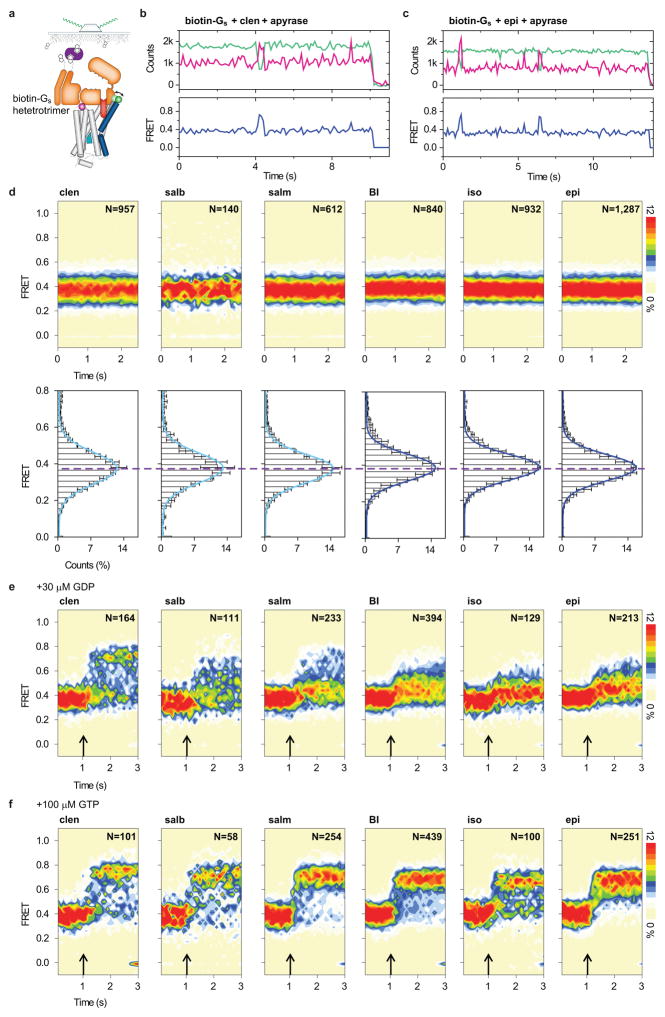
Extended Data Figure 6.
smFRET imaging of biotin-Gs-immobilized, labeled β2AR. a, Schematic of labeled β2AR immobilization via biotinylated Gs heterotrimer. b–c, Representative fluorescence (green for Cy3B*; magenta for Cy7*) and FRET (blue) time traces for biotin-Gs-immobilized, labeled β2Δ6-148C/266C imaged in the presence of clen (b) or epi (c) in nucleotide-free conditions (apyrase-treated). d, FRET population contour plots (top row) and histograms (bottom row) for biotin-Gs-immobilized β2Δ6-148C/266C imaged in the presence of partial and full agonists in nucleotide-free conditions. The dashed line indicates the invariant mean FRET value (~0.38) for all agonists tested. Histogram error bars represent the standard deviation from three replicates with N total molecules analyzed. e–f, FRET population contour plots of biotin-Gs-immobilized β2Δ6-148C/266C in the presence of agonists exhibiting FRET transitions upon rapid addition (arrow) of 30 μM GDP (e) or 100 μM GTP (f). Scale bar on the right indicates the relative population for the contour plots.

