Figure 2.

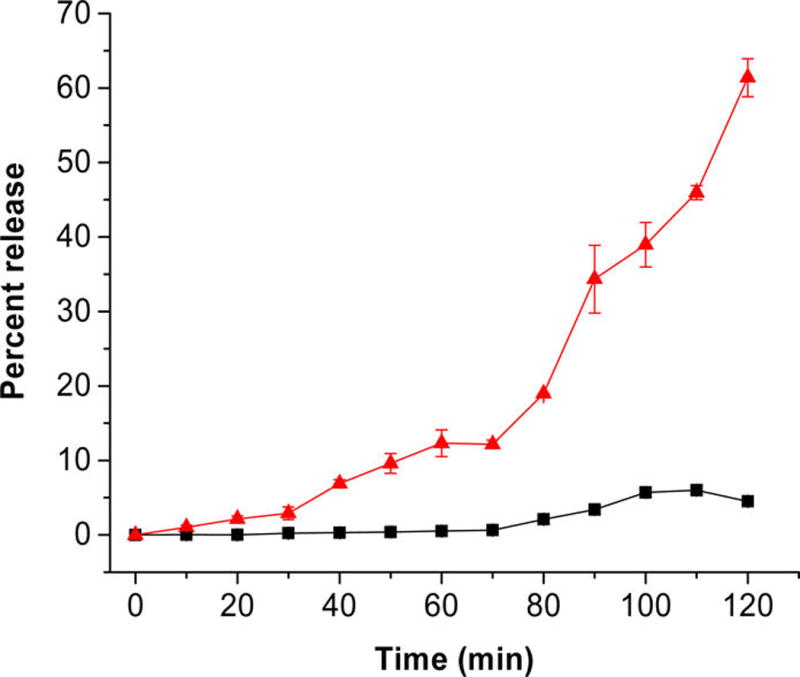
Dye release profiles from the LNs in hypoxic (red triangles) and normoxic (black squares) environment. The lines connecting the observed data points are shown (n = 3).

Dye release profiles from the LNs in hypoxic (red triangles) and normoxic (black squares) environment. The lines connecting the observed data points are shown (n = 3).