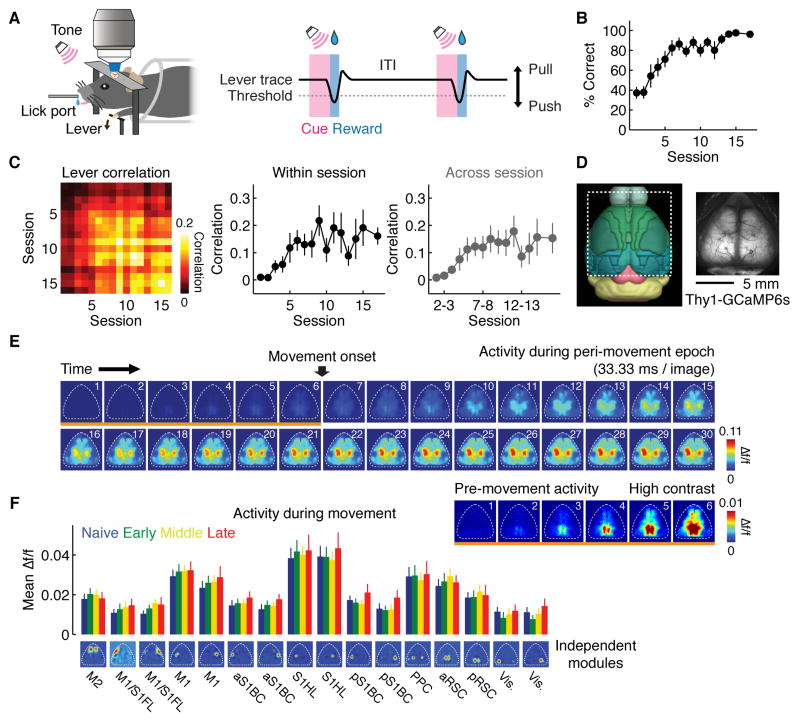
Figure 1. Behavior and wide-field calcium imaging.
(A) Left, experimental setup. Right, task structure. ITI, inter-trial interval.
(B) Behavioral performance (p < 0.001, n = 8 mice, Kruskal-Wallis test, mean ± SEM). The last time point is the average of 3 sessions after the 15th session.
(C) Left, correlation matrix of the lever trajectory in individual trials. Each box represents the median of all pairwise trial-by-trial correlations of movements from within or across sessions. Middle, trial-by-trial correlations of the lever trajectory within each session, corresponding to the central diagonal in the matrix on left (p < 0.01, n = 8 mice, Kruskal-Wallis test, mean ± SEM). Right, trial-by-trial correlations of the lever trajectory across adjacent sessions (p < 0.05, n = 8 mice, Kruskal-Wallis test, mean ± SEM).
(D) Field of view of wide-field calcium imaging in the mouse cortex expressing GCaMP6s under the Thy1 promoter (GP4.3 line). Left panel was obtained from the Brain Explorer 2 (Allen Institute for Brain Science).
(E) Example of Δf/f during the peri-movement epoch trial-averaged in a single session (between −200 ms and +800 ms relative to the movement onset). Bottom right panel shows the images indicated by the orange underline with a different contrast, highlighting that activity in some areas start before movement onset.
(F) Amplitude of movement-related activity at each learning stage, measured by mean Δf/f between 0 ms and +800 ms relative to the movement onset (n.s. for all cortical modules, p > 0.05, n = 8 mice, regression, mean ± SEM).

