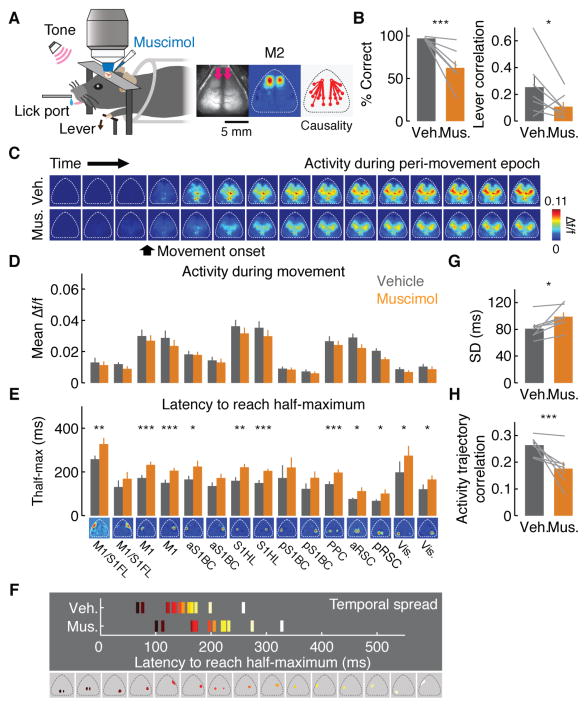
Figure 5. Impact of inactivation of M2 on network dynamics.
(A) Left, schematic of the experiment. Right, muscimol injection sites indicated by the pink arrows, M2 modules and directed functional connectivity from M2 measured by Granger causality analysis.
(B) Effect of module inactivation on behavioral performance. Left, correct rate (97.2 ± 0.6 % for vehicle, 62.4 ± 8.3 % for muscimol, ***p < 0.001, n = 7 mice, one-tailed bootstrap, mean ± SEM). Right, movement correlation (*p < 0.05, n = 7 mice, one-tailed bootstrap, mean ± SEM).
(C) Example peri-movement activity over 1 s with vehicle or muscimol injection in M2 (66.67 ms/image).
(D) Mean activity change with M2 inactivation compared to vehicle (n.s. for all cortical modules, p > 0.05, n = 7 mice, one-tailed bootstrap, mean ± SEM).
(E) Mean Thalf-max in cortical modules with vehicle or muscimol injection in M2 (***p < 0.001, **p < 0.01, *p < 0.05, one-tailed bootstrap, corrected for multiple comparisons by false discovery rate, n = 7 mice, mean ± SEM).
(F) Temporal spread of sequential activity with vehicle or muscimol injection in M2.
(G) Temporal spread of trial-by-trial sequential activity with vehicle or muscimol injection in M2 (*p < 0.05, n = 7 mice, one-tailed bootstrap, mean ± SEM).
(H) Mean pair-wise correlations of neural trajectories in the state space defined by the 5 factors from factor analysis with vehicle or muscimol injection in M2 (***p < 0.001, n = 7 mice, one-tailed bootstrap, mean ± SEM).

