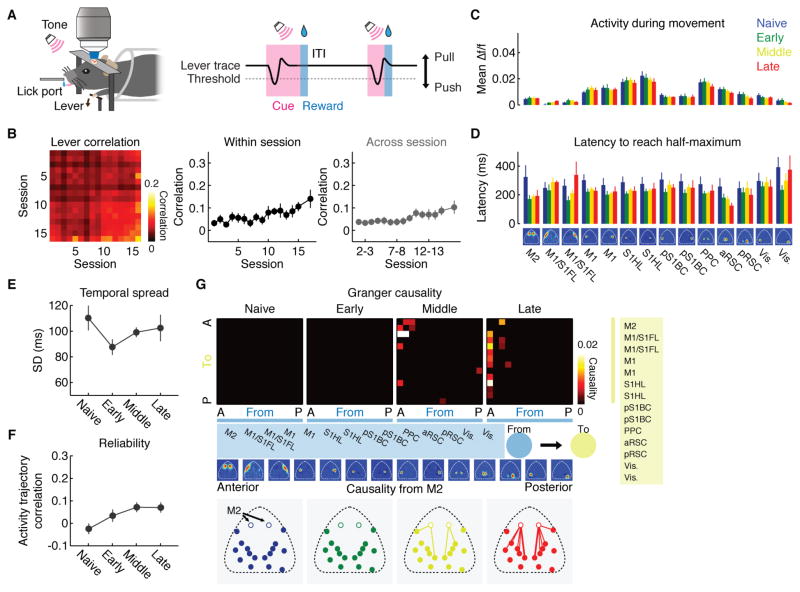
Figure 7. Analysis of no-task mice.
(A) Experimental setup. In each trial, the cue period varied randomly between 2 to 5 s, which was followed by reward delivery without the requirement of lever-press. Spontaneous lever movements were continuously monitored.
(B) Left, correlation matrix of the lever trajectory in individual trials. Middle, trial-by-trial correlations of the lever trajectory within each session, corresponding to the central diagonal in the matrix on left (p < 0.05, n = 12 mice, Kruskal-Wallis test, mean ± SEM). Right, trial-by-trial correlations of the lever trajectory across adjacent sessions (p < 0.05, n = 12 mice, Kruskal-Wallis test, mean ± SEM). Unlike the task condition, lever movement stereotypy only mildly increased, indicating a much lower level of motor skill learning in these no-task mice.
(C) Amplitude of movement-related activity at each stage of no-task mice, measured by mean Δf/f between 0 ms and +800 ms relative to the movement onset (n.s. for all cortical modules, p > 0.05, n = 12 mice, regression, mean ± SEM). Since aS1BC were not commonly identified across the no-task mice, these modules were not considered.
(D) Thalf-max of 14 cortical modules at each stage (n.s. for all cortical modules, p > 0.05, n = 12 mice, regression, mean ± SEM). Naive, session 1; Early, sessions 3, 5 and 7; Middle, sessions 11, 13 and 15; Late, sessions 16–18.
(E) No temporal compression of sequential activity over no-task sessions (p = 0.56, n = 12 mice, regression, mean ± SEM).
(F)Top, mean pair-wise correlations of neural trajectories in the state space defined by the 5 factors from factor analysis over control sessions (p < 0.01, n = 12 mice, regression, mean ± SEM). Note that although there is a small increase in the activity trajectory correlations over sessions, they are generally lower than the task mice.
(G) Top, matrix of median Granger causality at each stage of no-task mice. Bottom, spatial map of causality from M2 (open circles) to other brain areas at each control stage. Note that the causality from M2 is weaker and its emergence is slower than the task mice.

