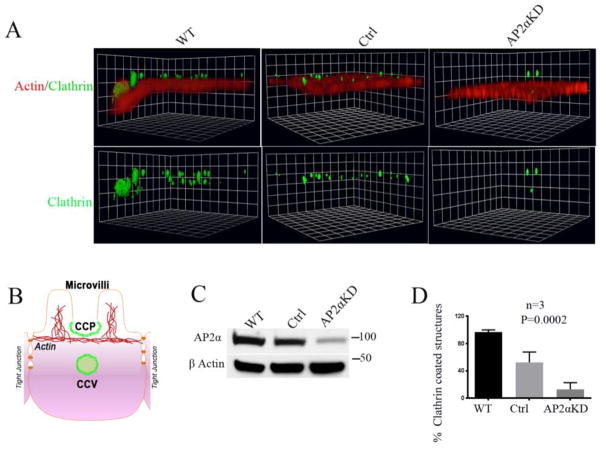
Figure 3. Actin and clathrin IFL in polarized AP2αKD C2BBe cells.
A. A representative 3 D reconstruction image shows the concurrent distribution of CCS relative to the brush border (BB) (marked by actin label). gSTED Z-stack images were captured by confocal microscopy and processed by volocity software as described in material and methods to visualize the CCS (pits in the plane of BB and vesicles below the plane of BB as shown in panel B). XY planes are at the mid-BB level. B. Schematic representation shows BB, clathrin coated pit (CCP) and clathrin coated vesicle (CCV) in a mature polarized enterocyte. C. Immunoblot reveals efficiency of AP2αKD in cells prior to fixation for IFL labeling. D. Quantification of CCS in WT, control and AP2αKD C2BBe cells. N= 3 images quantified for each condition.

