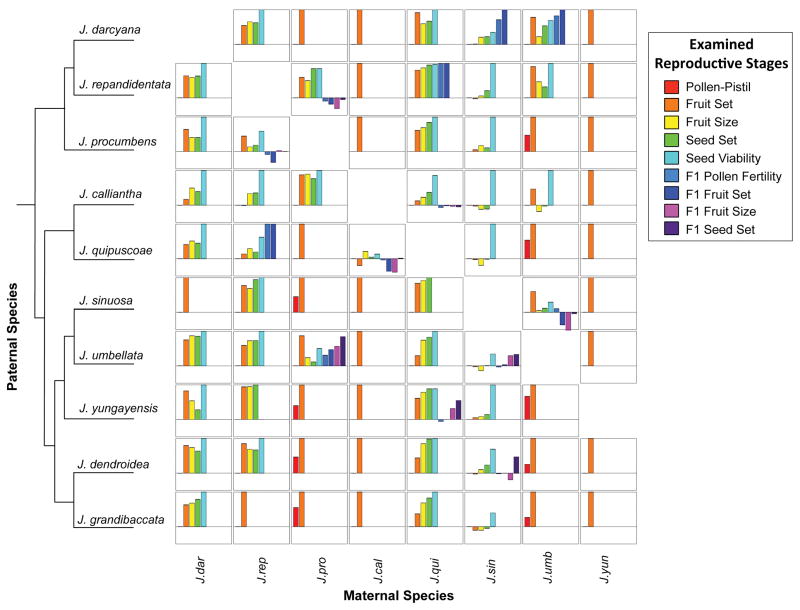
Figure 2.
Reproductive isolation for examined species combinations, across 9 postmating stages. Columns represent species acting as the mother while rows represent species acting as the father, arranged in phylogenetic order as shown in the cladogram. Cladogram based on the 60 transcripts used to estimate genetic distance (see Methods). Within each cell, different barriers are arranged along the x-axis, and RI values ranging from −0.5 to 1 along the y-axis.

