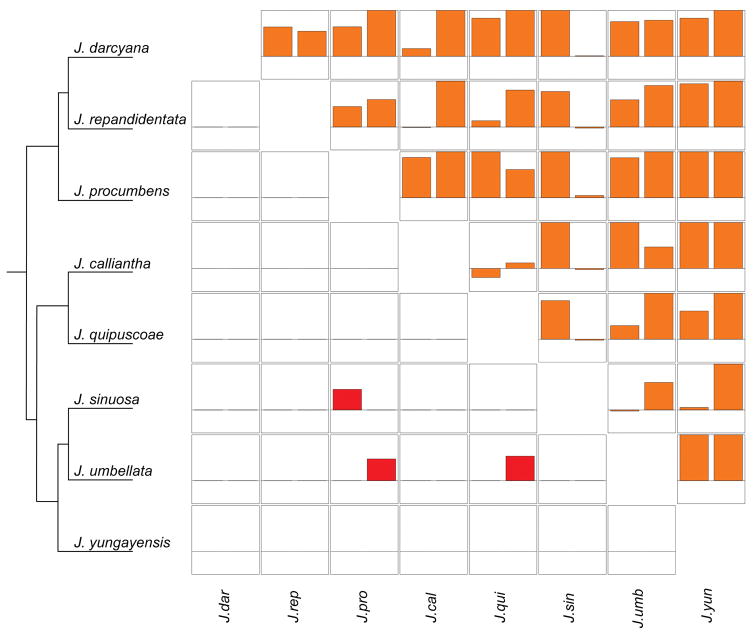
Figure 3.
Reproductive isolation in both reciprocal directions for two focal stages, Pollen-Pistil (bottom diagonal) and Fruit Set (top diagonal). Each cell represents a single inter-specific pair with RI values from Species A × Species B and Species B × Species A plotted adjacently. The y-axis represents RI values ranging from −0.5 to 1. Species are arranged phylogenetically following Figure 2, although J. dendroidea and J. grandibaccata are not included because they were primarily used as pollen donors (therefore asymmetry could not be calculated).

