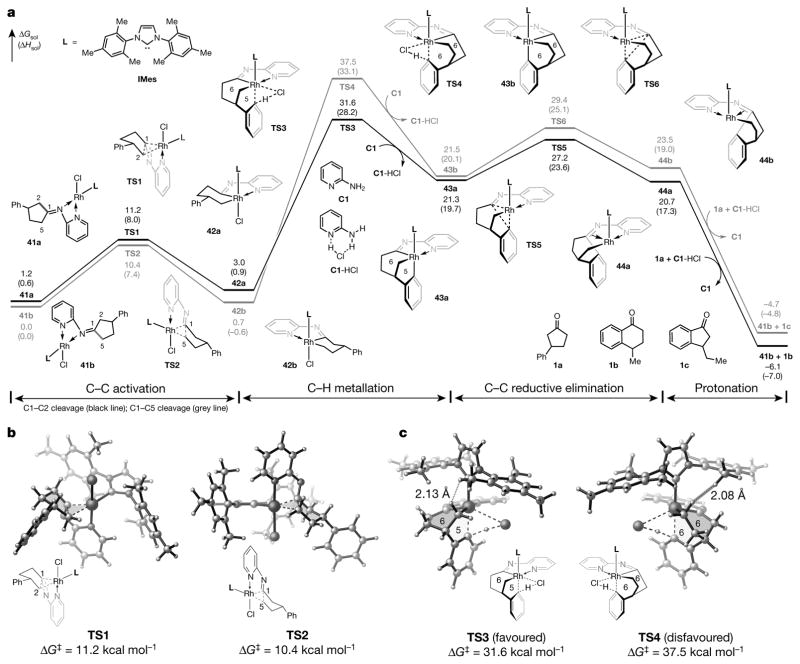
Figure 4. DFT-computed pathways for the activation of C–C bonds in cyclopentanones.
a, The computed reaction energy profile of the reaction with cyclopentanone 1a. L, ligand; TS, transition state; ΔGsol, Gibbs free energy with respect to 41b (given in kcal mol−1); ΔHsol, enthalpy with respect to 41b (given in kcal mol−1). b, Transition states during C–C bond activation. ΔG‡, Gibbs free energy of activation. c, Transition states during C–H bond cleavage. Energies are computed at the M06/SDD–6-311+G(d,p)/SMD (1,4-dioxane) level of theory, with geometries optimized at the B3LYP/LANL2DZ–6-31G(d) level (see Supplementary Information for more details and references).

