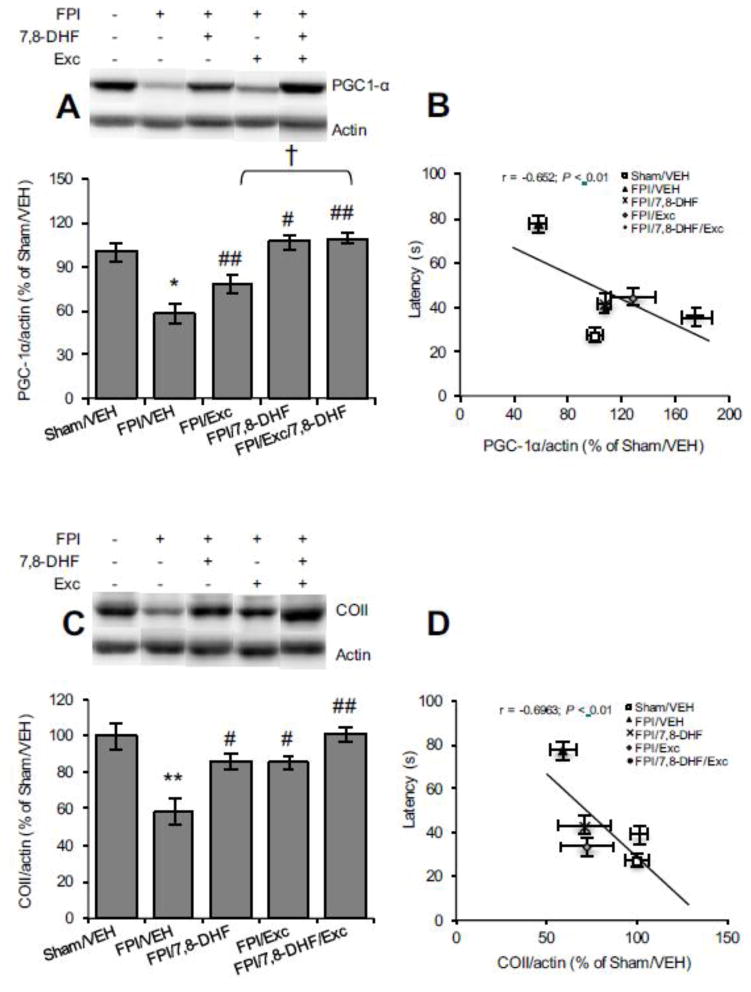
Fig. 5.
Protein levels of (A) PGC-1α, (B) correlation analysis of PGC-1α with latency time in Barnes maze test, (C) COII levels and (D) correlation analysis of COII with latency time in Barnes maze test (the solid line represents the best fit linear regression line) with 7,8-DHF (5 mg/kg) or exercise their combination among rats subjected to either fluid percussion injury (FPI). Data are presented as percentage (%) of Sham/VEH (mean ± SEM). *P < 0.05, **P < 0.01, relative to Sham/VEH; #P < 0.05, ##P < 0.01, relative to FPI/VEH; †P < 0.05, relative to FPI/7,8-DHF or FPI/Exc (One-way ANOVA followed by Bonferroni test).

