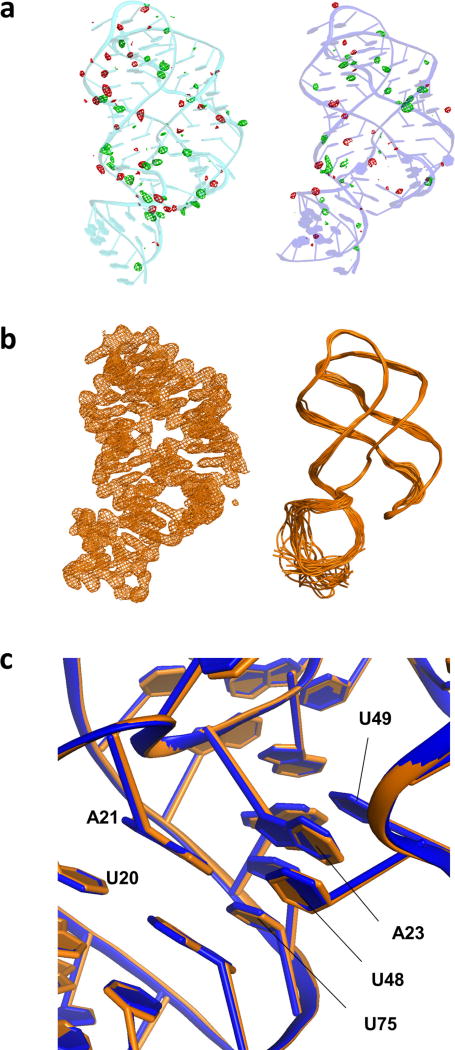
Extended Data Figure 7. Fo − Fc and 2 Fo − Fc electron density maps, and ensemble refinement model for the 10-s-mix data.
a, Weighted Fo − Fc difference electron density maps in green (3σ) and red (−3σ), computed using the apo structure (apo2, cyan; apo1, blue) and the structure factors from the 10-s-mix data. The isolated peaks, most likely corresponding to backbone phosphates, indicate a mixture of conformational states, and are predominantly in and around the three-way junction of the apo2 structure. b, 2 Fo − Fc electron density map (1σ, left) and time-averaged molecular dynamics ensemble refinement model (right) for the ‘apo1-like’ molecule of the 10-s-mix structure. c, Superimposition of apo1 (blue) and the apo1-like molecule of the 10-s-mix structure (orange), indicating no structural changes to apo1 after 10 s of mixing with ligand.

