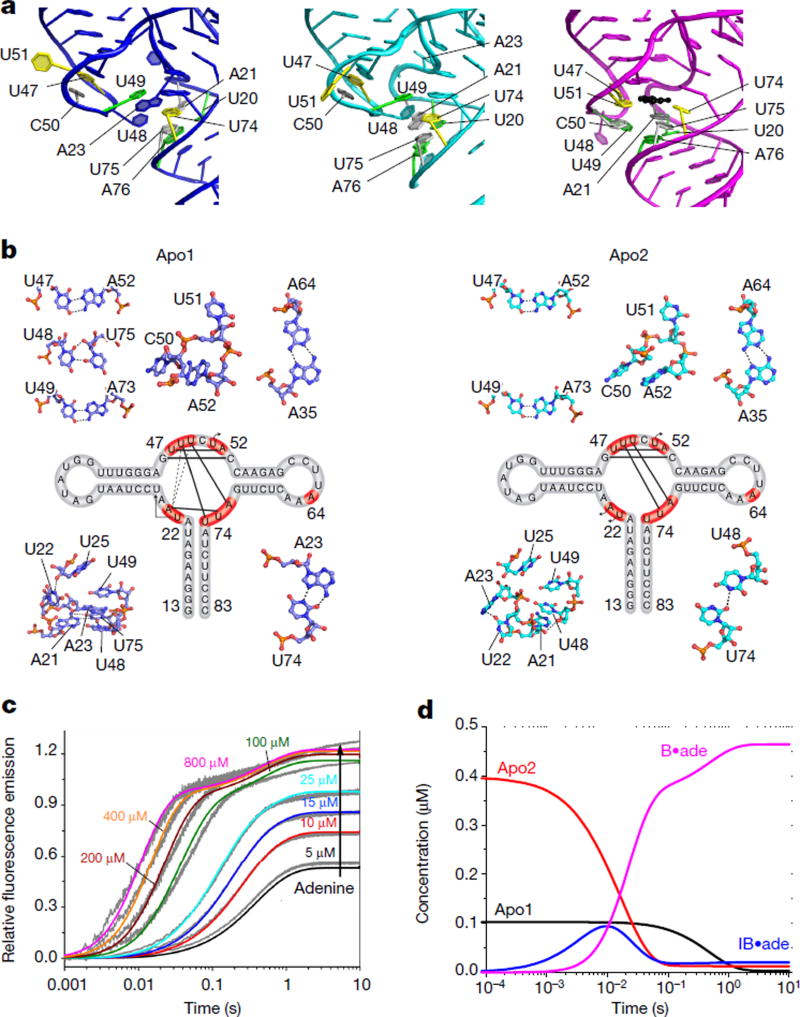
Figure 2. Structures of the three-way junction in the absence of ligand.
a, The three-way junction, as observed in apo1 (blue), apo2 (cyan), and ligand-bound (magenta, PDB code 4TZX) structures, with base triples (yellow, grey and green) and adenine ligand (black) indicated. b, Secondary structures and detailed interactions (shown as ball-and-stick) of key residues (red) within the junctions of each of the apo conformers. In the secondary structure map, base pairs are depicted as solid black lines, and the movements of residues that flip outward are shown as black arrows. The stacking of A23 between U48 and U49 in apo1 is illustrated as dotted lines. c, Trajectories are shown for eight concentrations of adenine and are globally fit to the model in equation (1) (Supplementary Discussion). d, Evolution of species concentrations over time (Supplementary Discussion).

