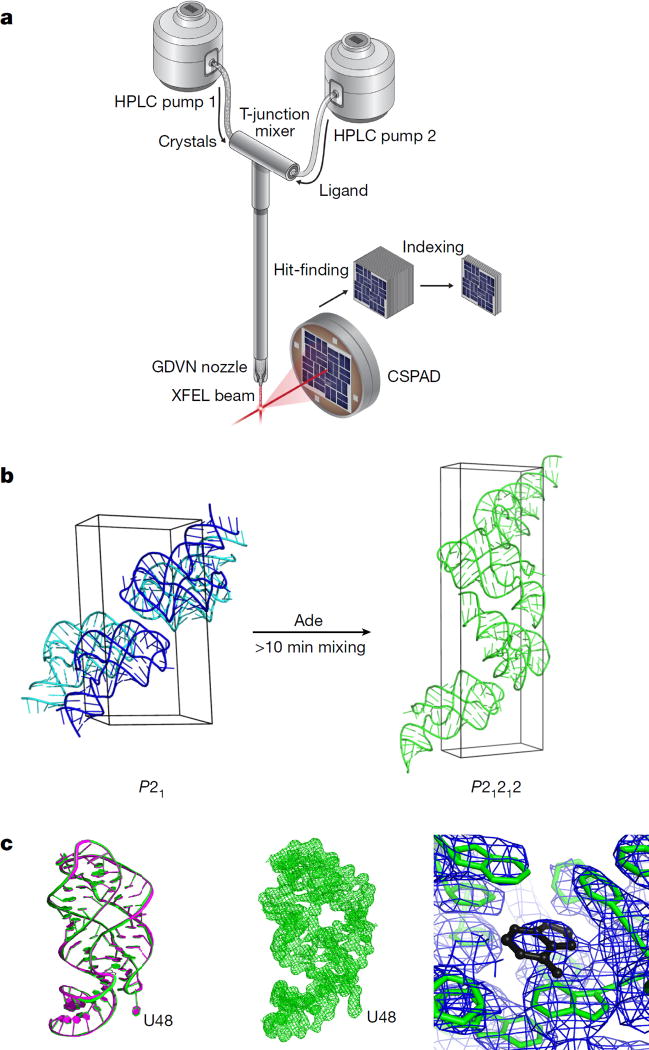
Figure 3. Setup of mix-and-inject SFX and conversion of the structure and crystal lattice.
a, Cartoon of the SFX ligand-mixing experiment. For details, see Methods. b, The unit cells of the crystals of apo (P21) and ligand-bound (P21212), the structure of which was generated in crystallo from the apo structures after at least 10 min of mixing with the adenine ligand (Extended Data Fig. 5b, c). c, Superimposition (left) of the ligand-bound structures of the 10-min-mix (green) and PDB code 4TZX (magenta), and 2 Fo − Fc electron density maps contoured at 1σ for the whole structure of the 10-min-mix (middle) and the binding pocket (right) showing the ligand (black).

