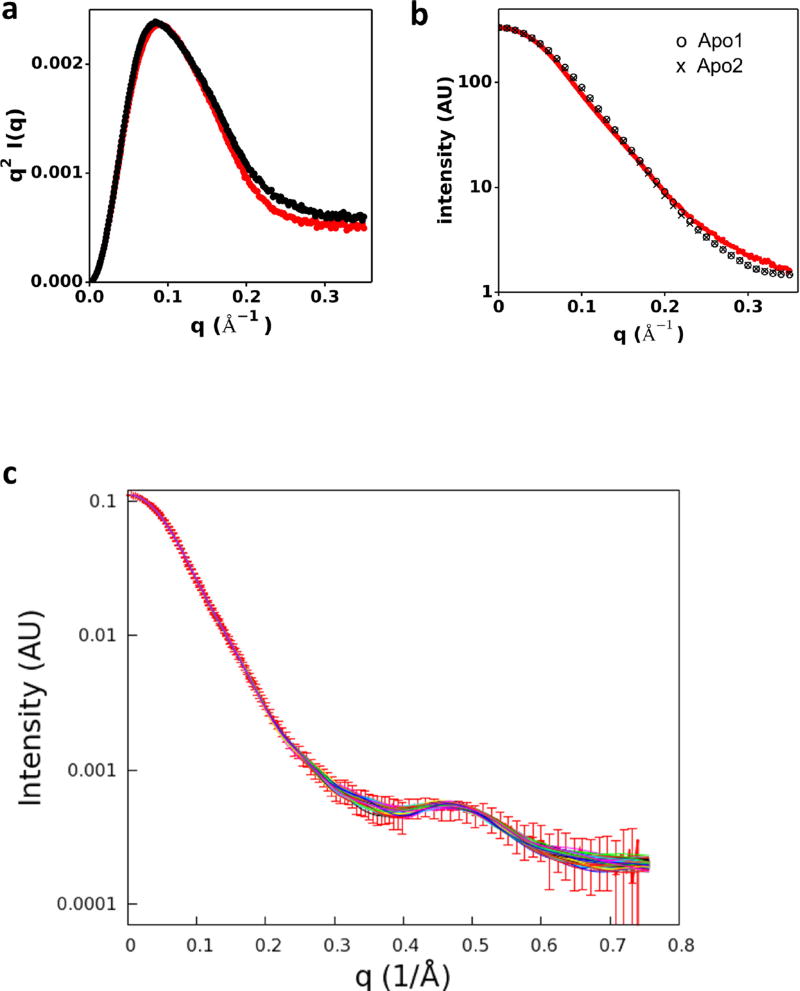
Extended Data Figure 2. Characterization of rA71 in solution by small angle X-ray scattering.
a, Comparison of the Kratky plots of the solution X-ray scattering curves of rA71 in the apo (black) and bound (red) states. b, Plot of back-calculated small angle X-ray scattering (SAXS) profiles of apo1 and apo2 conformers along with solution X-ray scattering curves of rA71 in the apo (red) states. c, Experimental SAXS curve shown in red with red error bars and superimposed with the SAXS curves that were back-calculated from 128 structures using the two-member ensemble calculation. The ratio of the two conformers (apo2:apo1) is approximately 0.9:0.1 to give the best fit to the experiment data with χ2 values ranging approximately from 0.1 to 0.3.

